CategoryValuation

Business scalability and valuation

B

My pervious post was about business scalability, a term used by Rakesh jhunjhunwala frequently. I attempted to lay out my understanding of the term in that post.

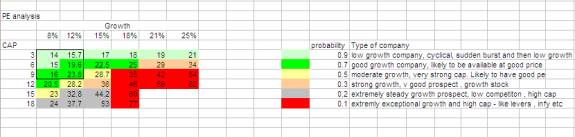
Business scalability is a critical factor in valuation. As I detailed on my post on intrinsic value, the DCF formulae can be used to calculate this number. There are two key variables in the formuale – Free cash flow and the duration of the same before the terminal value is applied. This duration also referred to as CAP (competitive advantage period) is the time period during which the company is able to earn above its cost of capital. Beyond this period the company earns its cost of capital and hence is valued at its terminal value.

A company with a scalable business will be able to grow its free cash flow faster (higher growth) and also have a higher CAP at the same time. Now higher the growth and CAP, higher is the intrinsic value. If you can identify such a company much before the market does, as Rakesh jhunjhunwala and other top investors are able to, then the returns are very very high.

However identifying such companies is not easy. The most common error I have seen with analysts is that they identify the market opportunity, pick a company most likely to do well and stop at that. The analysis should also involve analysing the business model in detail, identifying the key drivers of performance and doing an assessment of these drivers. If this sounds complicated, then it is. The value is not easily apparent and requires quite a bit of analysis and digging around. All this has to be done before the market recognizes the company and bids up the price.

I think this approach to investing is a very advanced form of investing. It is not easy for a novice investor to practise this form of investing easily. One should have a keen understanding of business models, valuations, economics and other aspects of investing. Graham or deep value investing requires much lesser expertise and also has more diversification of risk. However this form of investing, where an investor can correctly identify a scalable business, is the key to long term riches.

Business scalability

B

I received the following question from rathin and thought that this a good question which cannot be answered in a short comment.

Hi Rohit,Can you elaborate more on “Business scability”…Rakesh JhunJhunwala emphasises on that…Can you also give one practical example of a company??

Rakesh Jhunjhunwala empahsizes the term ‘business scalability’ a lot in his interviews and presentations. Let me try to give my understanding of of the term

I think business scalability should be analysed based on two key factors

1. Market opportunity – How big is the addressable market, the company is trying to target
2. Business model – How scalable is the business model in its ability to tap the above opportunity profitably

Let me expand further on the above two points via some examples

Lets take the example of Bharti or any other similar telecom company.

Market opportunity – The market opportunity is case of telecom is huge. Telecom services are still far below international level and even after years of hyper growth, there is still a large untapped market. Market opportunity is easier to identify and one can compare the indian market with other markets to get a sense of it. However the fallacy by most analysts is to take a direct linear estimation. For ex: for argument sake US consumes 20 Kg of choclate per capita per annum. India’s per capita consumption is say 100 gm. so the market opportunity is 200 times that of US.

This is a very simplistic approach and should be taken with a pinch of salt. There are far more variables involved in evaluating market opportunity and a range of values for most products and services should be considered.

Business model – This is far more complex to analyse. This is where the genius of investors such as Rakesh jhunjhunwala is apparent. They are able to evaluate the business model far in advance and are able to judge if the business model of the company can scale profitably.

For ex: In case of telecom, there is a huge upfront investment in the infrastructure, license, setting up the marketing infrastructure etc. However once these investments are done, incremental cost of gaining a Rupee of revenue is low. Such business models are far more scalable

To get technical – The marginal cost remains steady or reduces in scalable models. Such companies get more profitable as they grow.

In contrast lets look at IT companies. It is apparent that the market opportunity is large. However the business model is not as scalable as Telecom. Here the relationship of revenue and cost is at best linear. In some case there may be a disadvantage to the scale. As the company grows larger, you need to manage more employees, have more layers and there are other costs involved in managing such large organizations. The top tier IT companies now have 100000 employees . A 10% CAGR growth for next 10 years , which is not a high assumption , would take the employee strength to 1 million plus. So you are talking of model which is not as scalable as Telecom

Lets take an extreme example of a roadside eatry. The addressable market is big. However the business model is not scalable as the eatry can only serve limited geography and may be limited by the competency of its owner and the employees running it. However if the owner can develop a franchise and start licensing it, then the model is scalable. Alternatively if the owner can brand its product then it is scalable to a certain extent

Among the two factors discussed above, I think the more crucial aspect is the scalability of the business model and how competent would the management be in tapping the external opportunity.

Next post: How does scalability impact valuations ?

Valuation – some more thoughts

V

I covered my approach to estimating the appropriate PE for a stock and reverse engineering the current valuations in the previous posts. This is ofcourse not the approach taken by analysts. The typical approach is to look at the past history and decide on the likely earnings (and not even free cash flow). If the analyst is optimisitic he slaps on a high PE and voila ..we have the price target. To support the argument, the analyst does a comparison with other companies in the sector and tries to justify the PE. So we may have an optimisitic earnings estimate and on top of that a high PE attached to it, which would amount to double counting.

That is an incomplete approach. If the sector is in a bull run or has very high valuation then you are committing the same mistake twice. First assuming an optimistic estimate of earnings and then applying a high PE. Don’t believe me ? …well several IT companies sold for a PE of 100 in 2000 and real estate and capital goods companies sell for similar high valuations. Average PE for IT companies is now below 20 and mid caps in IT sometimes sell for less than 10 times.

This brings me to some interesting observations which you can derieve from this table below

For a company to justify a PE of 30+ the following has to happen – The company has to grow a more than 15-18% per annum for 9-10 years and maintain a ROE or ROC of 15% or higher. That would justify the PE of 30. If a company sells for that PE, then for you to make money the company has to do better than that. PE ratios of higher than 40, require higher growth, higher ROC and much longer CAPs.

Is that likely ? well it can happen …but don’t bet on that. Industries which have high growths and high ROC tend to attract a lot of competiton which drives the returns down. That’s a given rule of economics.

As a result I am wary of companies having a high PE. To justify an investment, the company has do better than the implied value (which you can get from the table above).

Final point – I have put comments on the right of the table with color schemes. Red means stay away for me !

Valuation – reverse engineering the stock price

V

I discussed my approach on evaluating PE ratios (see here). In addition based on the table shown in the previous post, we can work out the assumptions built into the stock price in terms of the ROC, CAP and growth rates. These variables can be compared with the actual and expected results of the company to decide if the stock is undervalued or not. Sounds easy in concept, and it is if you understand the company and the industry well. This approach is also called as expectations investing and I learnt about it in the book -.expectationsinvesting. I would recommend reading this book to understand DCF and the previous post better.

The above approach is a very useful tool in analysing a company. Let me give two examples.

Example A – CRISIL . This company sells for a PE of almost 60+. The embedded expectations are
ROC – 25% (current value)
Profit growth ( Net profit = Free cash flow) – 18% p.a for last 6 years
CAP – 20 years

Basically the company needs to grow at 18% per annum for the next 20 years and maintain the ROC. The company would be earning a net profit of almost 1000 odd crores by then. To make money on the stock in long run, one has to believe that the company will do better than what is implied by the stock price. Will the company do as good or better than implied above? I don’t know and certainly not comfortable or confident of a company to do this well for such a long period of time.

Example B – Novartis. The company sells for an adjusted PE (take cash out from mcap) of around 7.
ROC – 50% +
Profit growth – around 10% per annum for last 6 years
CAP (implied) – 0 years (if you assume terminal value at 10-12 times cash flow).

Basically the company sells for 7 times earnings. Current earnings are around 90 crores on a very low capital base. In addition the company has strong competitive advantage. So with a mcap of around 600 odd crores, the company will earn the current investment back in 5 years. The market is current pricing novartis with an assumption that the company will be out of business in 4-5 years.

I have given the two examples for illustrative purposes only. It does not mean that the stock will do well for novartis in the next few months or do badly for Crisil. But the above analysis is useful in making investment decisions.

Valuation – How to evaluate the PE ratio

V

I had done a quick valuation exercise of MRO-TEK earlier (see here). I used a certain PE ratio in the post and said that I would explain my approach later. So here it goes …

To understand my approach, you have to look at the file Quantitative calculation and worksheets – cap analysis and ROC and PE. You download this file from the google groups
The worksheet ‘ROC and PE’ has DCF (discounted cash flow model) scenarios for various businesses such as Low growth, high ROC (return on capital ). For ex: Like Merck or high growth and high ROC like infosys etc.

As you can see in excel screenshot, I have put a growth of around 10% in Free cash flow, ROC of 40% and calculated the Intrinsic value (or Net present value). The ratio of the NPV/current earnings gives a rough value of PE for the above assumptions

Now I have used various assumptions of growth, ROC etc and created the matrix below (CAP analysis worksheet in the same file)

The above is for a matrix of ROC (return of capital = 15%). I have varied the growth and CAP (Competitive advantage period).

As you would expect, if growth increases, so does the intrinsic value and the PE. If the ROC increases the same happens. This is however ignored by most analysts and sometimes the market too. This is where opportunity lies sometimes. The third variable – CAP also behaves the same. Higher the period for which the company can maintain the CAP, higher the intrinsic value and higher the PE. CAP or competitive advantage period is not available from any annual report or data. It is the period for which the company can maintain an ROC above the cost of capital. For a better understanding of CAP, read this article – measuringthemoat from google groups. It’s a great article and a must read if you want to deepen your understanding of CAP and DCF based valuation approach.

As I was saying, CAP is diffcult to estimate as it depends on various factors such as the nature of industry, competitive threats etc. I usually assume a CAP of 5-8 years in my valuations. If it turns out to be more than that, then it serves as a margin of safety.

Now when I look at the company, I use the worksheet ‘ROC and PE’ and my thought process (simplified) is as follows

1. Look at ROC – does the company have an ROE or ROC of greater than 13-14% ? If yes, is it sustainable (this is subjective).
2. Use the above worksheet to select a specific ROC sceanrio.
3. What has been the growth for the company in the last 8-10 years. What is the likely growth (again subjective estimates).
4. What is the likely CAP? This is a very subjective exercise and requires studying the company and industry in detail. If the company checks out, I usually take a CAP of 5-6 years.
5. Plug the ROC, growth, CAP and current EPS numbers in the appropriate sceanrio and check the PE. That is the rough PE for the instrinsic estimate.
6. Check if the current price is 50% of the instrinsic value
7. Cross check valuation via comparitive valuations and other approaches.

If all the above checkout, it is time to pull the trigger.

In case the above has not bored you to tears, 🙂

Next posts: Some conclusions from table for CAP v/s PE v/s Growth (CAP analysis worksheet), pointers on DCF etc etc.

Maintenance capex calculation

M

I discussed about maintenance capex and its relation with Free cash flow. To recap

Free cash flow = Net earnings + depreciation – maintenance capex

And free cash flow is the money the owner of business can take out or re-invest in the business.

Maintenance capex however does not have a precise formulae. That does not mean you cannot calculate it. But as you can see, if valuation is based on free cash flow which itself is based on an imprecise measure such as maintenance capex, it cannot be precise in itself.

Valuation depends on free cash flow, project growth rates , terminal value and the discount rates. All these are estimates and hence valuation is itself an estimate. That is the reason I find it assuming when analysts give reports where they give precise valuation targets and on top of that even the duration (next one year !!) when the target would be met.

So, coming back to maintenance capex, how do I estimate it? let me warn you at the outset. My approach is self developed, imprecise and only roughly right.

I will use my valuation template to explain my approach

Worksheet – anal – In this worksheet I fill up the sales, depreciation, wcap etc. On line 26, I calculate the additional capex (additional fixed asset and Wcap for the year). Line 27 is capex as % of sales. This gives me a capex trend (total) for a period of time for the business. I then use this trend to estimate the maintenance capex.

For ex: if the business has an asset turn (on average) of 2, then I would assume capex as 2.5% of sales

Sales = 100
Asset = 50
Inflation increase in sales = 5
Corresponding asset required = 2.5 (2.5% of sales)

If the business is asset heavy (commodity industry) then the maintenance capex as % of sales is high.

If the asset turn is 1, then maintenance capex would be roughly 5% of sales. You can compare this % with depreciation as a % of sales to see if both are roughly equal.

You may find some errors in my worksheet and I plan to load an updated version soon. I don’t use these worksheet very frequently now. After using these worksheets for several years, I am now in a position where I can look at the numbers and estimate if the company looks roughly undervalued. A lot of companies don’t pass that test and are rejected outright. If a company passes that filter, I fill up the excel and go through the entire exercise (which is not very precise in itself)

I have loaded a few samples in the google groups. If you go through this exercise yourself several times, you will see patterns and it will be faster for you too.

In addition to the above excel, please have a look at the excel – Quantitative calculation – worksheet : Maintenance capex to see the relationship between Sales, Asset turns, Maintenance capex and ROC.

Ofcourse you can have a counter argument – who the hell wants to go through such an elaborate exercise to value a company? Don’t I have better things to do in life 🙂

maintenance capex and FCF

m

I received the following question from sanjay shetty via email. I will try to answer the question and have also simplified it via several assumptions

You mentioned you “use maintenance capex needed to support unit volumes or competitive position (maintenance capex).”
I downloaded your Excel sheets couldn’t figure out the basis for calculation of the same, especially as companies don’t give break ups of maintenance capex. If you could explain would be great.
Maybe my understanding is incorrect, however I feel that all Purchase of Fixed assets should be deducted from Free Cash Flow especially when the amount out there is a yearly spend by the company to grow it’s business.

Let me start with the following definition for free cash flow (paraphrased) as given by warren buffet

Free cash flow = Net earnings + depreciation – maintenance capex

Now you can take the above formulae as a given or debate whether it is correct. I think it is correct as free cash flow is basically discretionary cash which the owners (actually managers on their behalf) of the business can choose whichever way to invest. It is discretionary cash because the business is left with this cash after it has incurred the required capex to maintain its current position in terms of volume and competitive position. If it does not do that, then the business will start degrading and may eventually be wiped out.

Now the discretionary cash can be spent in the following ways

1. Invest in the buiness itself if the returns are good – most common approach. Value adding if the business earns more than cost of capital . for ex: ITC, asian paints, HLL etc. This investment is in fixed assets and working capital
2. Accquire other company – Eg. Marico
3. Return cash to shareholder via dividends or share buyback
4. Just hold cash and do nothing – Ex: Merck, Novartis etc

Now the question – How to calculate maintenance capex? There is no precise formulae for that. The best you can do is to arrive at a rough number as companies don’t give this number. Let take the definition above and let me give my approach

If the maintenance capex is to maintain unit volumes, then value sales would be growing at the rate of inflation. So lets take a hypothetical case (simplified)

Sales = 100
Return on equity = 20% ( debt = 0)
Net margin = 10%
Total asset / sales = 2
Total asset = 50
Depreciation = 5 % of asset

Now in year 2
Sales = 105 (5 % inflation)
ROE = 20%
Net margin = 10%
Total asset / sales = 2
Total asset = 52.5
FCF = 10.5+2.5-2.5 [ asset increase = 2.5 ]

So in the simple case above FCF is equal to Net profit. Ofcourse reality is not so simple. However once you get an idea of the basic concept, you can do a rough estimation of the maintenance capex and free cash flow.

Key point to remember – If the ROE is in excess of 15%, generally the depreciation will covers the maintenance capex and the Net profit will be almost equal to free cash flow.

Exception to the above can be seen in some companies such as Gujarat gas/ HLL etc where the Working capital throws off cash and hence the FCF is actually greater than the free cash flow.

So in response to the question above, I would say that some amount of the Fixed asset has to be adjusted , but I would not deduct all the addition. For ex: A company launches a very profitable product and due to volume growth puts up a new plant. The cash flow may be negative during that year and then become positive a few years later. If you focus on the cash flow based on actual capex, you may undervalue the company when it is investing in a profitable venture and over value a company which is not investing and just milking its assets.

The above post may appear fairly academic and boring, but I think the question asked by sanjay goes to the core of how to value a company.
Next post : I will try to explain how I calculate FCF using the excels I have uploaded

Valuation of Banks – some thoughts

V

I have been reading the book – The warren buffett way (previous post here). There are several instances of valuations in the book on various companies such as Cap cities/ABC, American express etc. One point which caught my attention was the comparison of a company to a Long term bond investment. Buffett has mentioned several times that he uses the long term bond rates for discount in the DCF model.

Using the above comment, I have used the following thought process to look at another way of valuing a bank (earlier post on the same topic here).

The current long term rate for a 10 year bond is say 7 % (example purpose). So I would be ready to pay 100 Rs for this bond (face value). Now if I have a bond, say Bond B (of similar risk) which pays 14 % on face value, I would be ready to pay around Rs 188 for a face value of Rs 100 for the Bond B (A 7% bond would give 196 Rs in 10 years v/s 370 Rs for the 14 % Bond).

Taking the analogy to equity, lets consider a bank which has an ROE of 14%. Assume a 10 year period for which the bank can maintain this ROE ( This is the crucial part as this is the assestment an investor has to make on the competitive advantage of the Bank and its ability to maintain the high ROE). Beyond the 10 year period the bank’s ROE returns to 7% and so the bank in investment profile is similar to a Long bond.

In the above case, the Bank is similar in its return profile to Bond B. So everything else being equal I would value this bank at 1.88 times Book value.

Ofcourse the above is a very simple sceanrio. But we can add more complexity to the above case and make it more realisitic

Case 1: The ROE is 20 %. This ROE can be maintained for 10 years as in the above example. In such as case, I would value the bank at 3.14 times book value.

Case 2 : The ROE is 14%, but the Excess returns can be maintained for 20 years instead of 10. In such as case the valuation can be at 3.55 times book value

Case 3 : ROE is 20% and the period is 20 years. In that case the bank can be valued at 9.9 times book value.

So the simple conclusion is that higher the ROE and the longer the period for which it can be maintained, the higher is the instrinsic value of the bank (which is basic Discounted flow approach).

The above is a more shorthand approach of valuing a bank. I would look at the valuation in the following way now,

– What is the ROE for the bank
– What is the adjusted book value (net of NPA)
– What is the likely duration of excess return (select only a bank which is well run and hence the duration is atleast 10 years)

Based on the above factors I would prefer to invest at 1.5 – 2 times the adjusted book value (keeping a reasonable margin of safety).

Subscription

Enter your email address if you would like to be notified when a new post is posted:

I agree to be emailed to confirm my subscription to this list

Recent Posts

Select category to filter posts

Archives