It is widely understood that stock prices are forward looking – they discount the future expectations of cash flow of a company. In bear markets, these expectations are lowered as markets extrapolate recent trends (and assume a recession forever). On the flip side, the reverse happens during bull markets, when investors extrapolate the recent good results into the future and assume that there will be no hiccups along the way.
Finally, we have markets like now, where investors have gone ahead and extrapolated ‘hope’ and discounted that too.
The idea funnel
I maintain a 50+ list of stocks which I track on a regular basis and have created starter positions in a few companies which appear promising. The process i follow is to create a small position (usually 0.5% to 1% of my personal portfolio) and then track the company for a few quarters/ years.
In atleast 50% of the cases or more, I realize over time, that I am not too excited about the prospects of the company and exit the stock immediately. In a few cases, however the company and its stock may still hold promise. In such cases, I start raising the position size in the portfolios I manage.
The above approach allows me to run experiments with lots of ideas and controlled risk.
Discounting infinity and beyond
I am now noticing that some of the positions I hold on a trial basis have started running up based on hope.
Let me take one example to illustrate – Repro India.
Repro India is a printing business with operations in India and Africa. The company performs print jobs for publishers for all kinds of printed materials like books, reports etc. The company has had a chequered past with uneven performance.
The company was growing till 2012-14 with rising sales in India and Africa. The return on capital of this business was mediocre as the printing business involves high fixed assets, high and sticky receivables with average operating margins in the range of 15-18%.
The export business in Africa went into a nose dive in 2014 due to the drop in oil prices. The company was not able to collects its receivables as these African countries faced currency issues and hence incurred losses. Since then the company has been slowly recovering the receivables and nursing the business back to health. In addition the domestic business continues to be competitive and sub-optimal due to the lack of any competitive advantage
I would normally avoid such a company unless there are some prospects of improvement or change in the future. One such possibility exists for the company. This is the new BOD – books on demand business of the company.
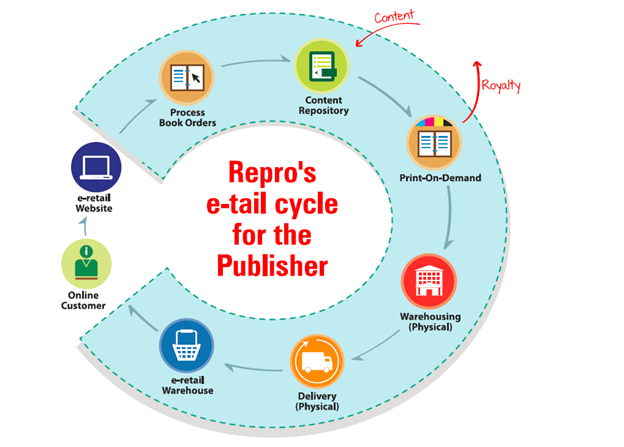
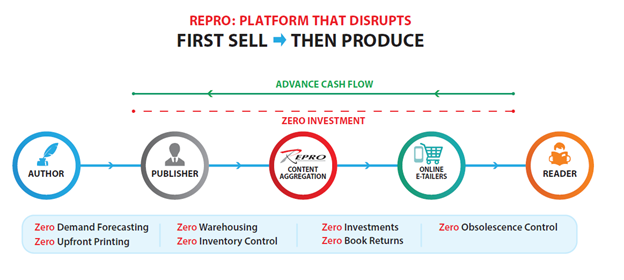
The BOD business is similar to an aggregation model followed by companies such as uber or Airbnb. In the case of repro, the company has a tie up with Ingram (another US based aggregator) and other publishers in India to digitize their titles and carry them on its platform. These titles are then made available through ecommerce sellers such as Amazon or flipkart. When a user like you and me finds this title and purchases it, Repro prints the copy and delivers it you.
The business model is depicted in the picture below (From the company’s annual report).
The above business model ensures that there is no inventory or receivables for Repro or the publisher. The payment is received upfront and the product is delivered at a later date. This is a win-win business model for all the value chain participants as it eliminates the need for working capital. As a result, this business model is able to earn a high return on capital with the same or lower margins than regular publishing
Illustration from the company’s annual report
Repro is doing around 40-50 Crs of sales in the BOD segment and growing at around 70-80% per annum. The company has loaded around 1.4 Mn titles on its platform and plans to load another 10 Mn+ titles in the future. This business is at breakeven now. The BOD business has a lot of promise and it’s quite possible that the company will do well.
However, success in the business is not guaranteed. The company needs to scale its operations and could face competition from other print companies in the future (as the entry barriers are not too high).
The market of course does not care about the uncertainty. There are times, when markets refuse to discount good performance in the present and then there are time like now, when the market is ready to discount the ‘hope’ of good performance in the future. The stock sells at around 100 times the current earnings. As the legacy printing business continues to be mediocre with poor economics, it is likely that the high valuations are mainly due to the exciting prospects of the BOD business
I had created a small position a couple of months back and have been tracking the company. The stock price has risen by around 50%, 60% since then even though the company is just above breakeven on a consolidated level.
I am optimistic about the prospects, but the execution needs to be tracked. I am not willing to pay for hope and so I am a passive observer for now.
—————-
Stocks discussed in this post are for educational purpose only and not recommendations to buy or sell. Please contact a certified investment adviser for your investment decisions. Please read disclaimer towards the end of blog.