CategoryInvestment process

Discounting hope

D

It is widely understood that stock prices are forward looking – they discount the future expectations of cash flow of a company. In bear markets, these expectations are lowered as markets extrapolate recent trends (and assume a recession forever). On the flip side, the reverse happens during bull markets, when investors extrapolate the recent good results into the future and assume that there will be no hiccups along the way.

Finally, we have markets like now, where investors have gone ahead and extrapolated ‘hope’ and discounted that too.
The idea funnel

I maintain a 50+ list of stocks which I track on a regular basis and have created starter positions in a few companies which appear promising. The process i follow is to create a small position (usually 0.5% to 1% of my personal portfolio) and then track the company for a few quarters/ years.

In atleast 50% of the cases or more, I realize over time, that I am not too excited about the prospects of the company and exit the stock immediately. In a few cases, however the company and its stock may still hold promise. In such cases, I start raising the position size in the portfolios I manage.
The above approach allows me to run experiments with lots of ideas and controlled risk.
Discounting infinity and beyond

I am now noticing that some of the positions I hold on a trial basis have started running up based on hope.

Let me take one example to illustrate – Repro India.
Repro India is a printing business with operations in India and Africa. The company performs print jobs for publishers for all kinds of printed materials like books, reports etc. The company has had a chequered past with uneven performance. 
The company was growing till 2012-14 with rising sales in India and Africa. The return on capital of this business was mediocre as the printing business involves high fixed assets, high and sticky receivables with average operating margins in the range of 15-18%.
The export business in Africa went into a nose dive in 2014 due to the drop in oil prices. The company was not able to collects its receivables as these African countries faced currency issues and hence incurred losses. Since then the company has been slowly recovering the receivables and nursing the business back to health. In addition the domestic business continues to be competitive and sub-optimal due to the lack of any competitive advantage
I would normally avoid such a company unless there are some prospects of improvement or change in the future. One such possibility exists for the company. This is the new BOD – books on demand business of the company.
The BOD business is similar to an aggregation model followed by companies such as uber or Airbnb. In the case of repro, the company has a tie up with Ingram (another US based aggregator) and other publishers in India to digitize their titles and carry them on its platform. These titles are then made available through ecommerce sellers such as Amazon or flipkart. When a user like you and me finds this title and purchases it, Repro prints the copy and delivers it you.
The business model is depicted in the picture below (From the company’s annual report).
The above business model ensures that there is no inventory or receivables for Repro or the publisher. The payment is received upfront and the product is delivered at a later date. This is a win-win business model for all the value chain participants as it eliminates the need for working capital. As a result, this business model is able to earn a high return on capital with the same or lower margins than regular publishing
Illustration from the company’s annual report

Repro is doing around 40-50 Crs of sales in the BOD segment and growing at around 70-80% per annum. The company has loaded around 1.4 Mn titles on its platform and plans to load another 10 Mn+ titles in the future. This business is at breakeven now. The BOD business has a lot of promise and it’s quite possible that the company will do well. 
However, success in the business is not guaranteed. The company needs to scale its operations and could face competition from other print companies in the future (as the entry barriers are not too high).
The market of course does not care about the uncertainty. There are times, when markets refuse to discount good performance in the present and then there are time like now, when the market is ready to discount the ‘hope’ of good performance in the future. The stock sells at around 100 times the current earnings. As the legacy printing business continues to be mediocre with poor economics, it is likely that the high valuations are mainly due to the exciting prospects of the BOD business
I had created a small position a couple of months back and have been tracking the company. The stock price has risen by around 50%, 60% since then even though the company is just above breakeven on a consolidated level.
I am optimistic about the prospects, but the execution needs to be tracked. I am not willing to pay for hope and so I am a passive observer for now.

—————-
Stocks discussed in this post are for educational purpose only and not recommendations to buy or sell. Please contact a certified investment adviser for your investment decisions. Please read disclaimer towards the end of blog.

A statistical analysis of failures

A

I have often written about experiments and failures in the past (see here, hereand here). These posts have usually involved a failed experiment or idea and my conclusions or learnings from it. It has been a case of inductive reasoning (going from the specific case to general principles).

I recently initiated an exercise where I collated all the investments I have made since 2010/11 and analyzed the success rate of my picks. I have defined failure as a stock position which delivered less than 13% CAGR over the last 5-6 years.

Why 13% and not an actual loss? There are a few reasons behind it

   13% is roughly the level of returns one can expect from an index and hence I have set that as the threshold
   It allows me to capture value traps as failures. These are stocks where the stock price has stagnated or trailed the index as I waited for valuations to revert to the long term averages.

The analysis was quite eye opening and although I had some vague idea of what to expect, the actual results were still surprising.

Surprisingly low hit rate


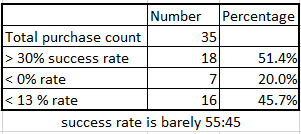
I have bought/ sold or held around 35 position in the last 6 years. Of these, I have lost money in 7 and consider 16 (or 45%) as failures (<13% category also includes the < 0% cases)

If you look at the above result, the conclusion could be that the overall portfolio has performed horribly. I am not going to share the actual results as that is not the purpose of the post and anyway I can claim anything in absence of independent verification. Let me just share that the portfolio has done substantially better than the common indices (substantial being 10% above the NSE 50 returns)

A common myth is that high returns need a 90%+ success rate (if not 100%).

The reason behind the myth

So why does almost everyone believe that one needs a perfect hit rate to achieve good returns? This myth is quite common as one can see from comments in the media, where people are surprised when some well-known investor has a losing position.

I think it speaks to the ignorance of the following points

   A losing position has a downside of 100% at the most, but a winning position can go up much more than that and cover for several such losses. Let’s say you have a portfolio of three stocks and two go to 0, but the third stock is a 5 bagger. Even in such an extreme example, the investor has increased his portfolio by 50% with equal weightage in all the three positions.
  Let’s take the previous example again and instead of equal weightage, let’s say the two failed position were only 10% of the portfolio, whereas the winning position was 90%. In such a happy scenario, the overall portfolio is up 4.5X.

In effect investors under-estimate the impact of upside from a winning position and the relative weightage of these winners. A portfolio is not like a true or false exam where every question gets the same marks. If you get something right, the weightage and extent of gain on that position matters a lot

So the next time, you read an article where some famous investor lost money on a position and chalk it to them being over-rated, keep in mind that the losing position could be a tiny starter position. A lot of investors sometimes start with a small position and then build it as their conviction grows.

The learnings

The main reason for this exercise was not to generate some statistics and leave it at that. I wanted to dig further and find some common patterns of failure. This is what I found

Blind extrapolation
The number no.1 failure for me has been when I assumed that the past performance of a company or sector would continue and hence the recent slowdown or poor performance is just a blip.

For example, I invested in a few capital good companies in 2010/11, assuming that the recent slowdown was just a blip. These companies appeared very cheap from historical standards and that motivated me to invest in some of them. I did not realize at the time, that the country was coming off a major capex boom and it usually takes 5+ years for the cycle to turn.

I have since then tried to dig deeper into industry dynamics and understand the duration of the business cycle of a company in more depth.

The forever cheap or value traps
These positions are a legacy of my graham style investing. These companies appeared very cheap by all quantitative measures. I would attribute the failure of these positions to the following reasons

These companies were earning low returns on capital as the management had very poor capital allocation skills. To add insult to the injury, some of these companies refused to increase the dividend payout and just kept piling cash on the balance sheet. In all such cases, the market took a very dim view of the future of the company. Unlike the developed markets, India does not have an activist investor base and hence these companies end up going nowhere.
  I forgot to ask a very basic question: Why will the market re-value this company? What needs to change to cause this revaluation? In most of these cases, the company performance was not going to change substantially for a variety of reasons, and hence there was no reason for the market to change its opinion.

The turn which never happened

There have been a few positions where my expectation was the company will start growing again or will improve its return on invested capital (or both). In all such cases, the expected turn never happened and the company just kept plodding along with me incurring an opportunity loss during this time.

The problem with these kind of situations is that you don’t lose money due to which one is lulled into complacency. One fine day, after having waited for a few years, I realized belatedly that I was waiting for something which was unlikely to ever happen.

I have now changed my process to identify the key lead indicators for a company which need to change to confirm that the management is moving in the right direction. For example, is the management introducing new products, expanding distribution or trying something else to revive the topline? If the annual report and other communication continues to be vague on these points, it is best to exit and move on

Doing too much

There is another pattern I have noticed which is not obvious from the table. I have had a higher number of failures after a successful phase. I think this is most likely due to over confidence on my part which led to a higher number of new ideas in the portfolio with much lesser due diligence on each of them. The end result of this sloppy work was a much higher failure rate.

The changes

It is not sufficient to just analyze failure. One need to make changes to the process in order to prevent the same error from occurring again

Some changes in my process/ thinking has been

–  It is difficult to invest in commodity/ cyclical stocks (atleast for me). I should tread cautiously and have a very strong reasoning behind such an investment (being cheap is not enough).
–  Identify the reasons on why a company will be re-valued by the market. Also have a time frame attached to it (endless hope is not a strategy)
–  Be your own critic. Confirm if the original thesis holds true? If not, exit. It is better to be proven wrong as quickly as possible.
–  Growth is not all important, but absence of it can lead to a value trap.
–  The most dangerous phase is right after a successful stretch. Resist the urge to extend your lucky streak by making investments into half-baked ideas. Take a break or vacation!

If there is one lesson from the above analysis you should take, it is that one does not need to have a very high hit rate to get decent returns. As long as one holds on to companies which are doing well and culls the poor performers rationally, the overall results will be quite good.

—————-
Stocks discussed in this post are for educational purpose only and not recommendations to buy or sell. Please contact a certified investment adviser for your investment decisions. Please read disclaimer towards the end of blog.

The search for a free lunch

T

Ask any serious, long term investor on the type of company he or she would like to invest and you will almost always hear something along the following lines – A high quality company with sustainable competitive advantage (aka Moat) and long term growth prospects, available at a cheap or reasonable price

So what’s wrong with the above statement? It’s almost a truism and a guarantee of great results ….

This is a long post and I am trying out a new approach. Instead of posting the entire post with all the headache around the formatting, I have converted it into a pdf. please download this post from below

The search for a free lunch

——————————————————————————————————————————-Stocks discussed in this post are for educational purpose only and not recommendations to buy or sell. Please contact a certified investment adviser for your investment decisions. Please read disclaimer towards the end of blog.


Not everything that counts, can be counted

N

In an earlierpost, I wrote about the two types of risks faced by an investor – risks faced by all investors irrespective of the nature of the investment and business risks associated with a particular investment.

In this post, I will try to describe a variety of business risks and how I use it via a checklists to further evaluate a business. The list I present below is by no means comprehensive (as I am not writing an academic paper) and just represent the ones I have faced in the past or can think of as I write this post.

Advance warning – this is a long post even if it is not comprehensive and there is no silver bullet or blue/red pill at the end to make investing easier.

Regulatory risk [earning excess returns from favorable regulations]
If a company is able to make above average profits due to a favorable regulation, then it is exposed to this risk. For example, think of a banking license or the right to supply natural gas to a specific geography such as Delhi in the case of indraprastha gas.

In these cases, the company has a pseudo monopoly due to a favorable regulatory position. If the terms of the regulation changes, the company could find that the economics of the business has worsened or worse, it no longer has a viable business at all.

There are a lot of examples of this kind of risk. For example, PNGRB – the gas regulator announced in april 2012 that they had the authority to fix gas prices and asked IGL to drop its price by 50%+. The company lost more than 50% of its value after the day of the announcement and since then has recovered most of it, after the supreme court overturned the decision. In spite of the favorable response, an investor in this stock has done worse than the index during the same time period.

The same story has played out for several companies in the mining space after the Supreme court order banning iron ore mining due to the illegal mining problem in some states. This kind of risk is critical in the case of telecom, power, finance and other heavily regulated industries.

The key point is this – If the business model of a company depends on specific regulations, then the company is always exposed to this kind of risk. . The company could be doing well for a long time and then suddenly the regulator or the government can change its mind and put the entire business at risk.

I have noticed that the market is usually sanguine about this risk and it is generally not priced in. However if the risk materializes, the reaction is swift and brutal. The only way to mitigate this risk is either to avoid such companies altogether or hope and pray that the regulator/ government does not change its mind on the key regulation.

Reputation risk [earning excess returns based on reputation/ brands ]
This is a key risk in those businesses which depend on the reputation of a brand or a company. If the company earns an above average profit due to a favorable image or brand position, then it is very important for the company to safeguard the brand.

In the event that there is some incident where the brand image is impacted, the management should react swiftly and prevent further damage to it.

Case in point – Maggi from nestle.  Irrespective of the merits of the case, the response of the company to the whole lead content issue and subsequent recall was appalling. The issue surfaced in April and the company finally responded in June when the issue blew up in the media. This is a 1.2 Bn dollar brand and the management did not react to the situation till it finally got out of hand.  Net result – The company lost close 20% of its market cap in the aftermath.

This risk is critical when the company you invest makes money based on the power of its brand and trust. The only way to mitigate this risk is to have a management which reacts promptly if it sees a risk to the reputation of the company or its brands.

Management risk [Poor quality management]
This is a risk commonly understood, accepted but least followed by a lot of investors. If you talk to someone who has been investing in the markets for a period of time, they will agree that it is important to invest only with a high quality management.

Lets first define what is high quality which I like to think of on two parameters

Capital allocation and distribution – does the management allocate capital at high rate of return in the business and distribute the excess to shareholders via dividends?

Ethical behavior towards all stakeholders – Does the management behave ethically or treat other stake holders (such as customers, employees, shareholders etc) in a manner they would like to be treated if the roles were reversed?

The first parameter is quite objective in a nature and can easily be verified by looking at the return on capital of the business over an entire business cycle. It is amazing to find that people end up investing with managements which have consistently destroyed wealth (several airlines come to mind). I understand that at a certain price, even a value destroying business can give good returns, but a majority of the investors end up buying such companies at the peak of a cycle when the profitability seems to be high (but is just a mirage)

The second factor is far more difficult to evaluate and needs careful study of the management’s actions over time. Again it is not easy to define the right behavior in several cases such as high compensation or bending regulations to gain an undue advantage in business.

Even if we leave aside some of the fuzzy stuff, it is quite easy in a lot of cases to just reject a company if several red flags pop up. In the end, my own experience has been that if you ignore this risk, it eventually catches up. A particular investment with unethical and incompetent management may not go south, but over time the law of averages work and the overall result will be poor.

The only way to mitigate this risk to avoid such companies and management. It will prevent a lot of anxiety, heartburn and sleepless nights

Customer concentration risk [All eggs in one or few baskets]
This risk arises when a company derives a large percentage of its revenue from a handful of customers. Although this is an easy to understand risk, it not necessarily as easy to evaluate.

For example, is it better for IT and other service companies to focus on their top customers who provide 80% of their revenue instead of spreading themselves thin? I don’t have an answer to this question.

There is one crucial factor to consider when thinking of this risk – Customer lock-in. If a customer is locked in with a company and cannot easily switch then it makes sense to devote enough resource to maintain this competitive advantage.

However if a customer can easily switch suppliers based on price, then customer concentration will kill a business. A company fighting price based competition and earning its revenue from a limited set of customers is never going to earn profits above its cost of capital and is likely to remain locked in a low return business.

This risk turns up in surprising places. China as a country is the largest consumer of most commodities such as steel. So when this ‘customer’ slowed, the price of the product collapsed and has hurt all suppliers in the product category. It does not matter if as a steel company you don’t supply to the Chinese market. Once the no.1 customer in the steel industry (accounting for 50%+ of global demand) slowed, everyone in the industry was going to get hurt.

There is no easy way to mitigate this risk and it requires a case to case decision. One needs to be aware of the level of concentration for the company and check if the management is focused on either reducing the concentration or has such as hold on the key customers, that it will not be exposed to price based competition.

Competitive risk
The easiest way to think about this risk is to count the number of companies in an industry and tabulate their market share. If you find just one company and that company has a 100% share, then you have found a monopoly with no competitive risk.

At the other extreme if you start listing the companies and end up with a long list of firms with each company having a tiny share of the market, then you are looking at an industry with high competition and poor returns.

I have generally used a simple thumb rule to evaluate this risk. If the top 3-5 companies account for 60%+ of an industry and most of them earn over 15% return on capital, then the competitive intensity within the industry is low. On the other hand, if I have to spend over a week finding all the companies in an industry and if the top 10 companies account for less than 50% share (assuming I can even get this number), then it is very likely I have stumbled into an industry with high levels of competition and poor profitability.

For example – most consumer brands have limited numbers of companies and high profitability. On the other hand, industries such as cement, textiles etc are the other end of the spectrum with a large number of companies and poor profitability.

As an investor, you can manage this risk by first diversifying across industries so that a sudden worsening of the economics in a particular industry will not sink the entire portfolio. The second way to manage this risk is to study each company and its competitive position in detail so that you are atleast aware of the risks and do not get blindsided by it. Finally, as an investor one is paid to understand and manage this risk.

Change or obsolescence risk
This risk is especially relevant in fast moving industries where the underlying technologies are going through a lot of change.  Think of telecommunications – this is a fast paced industry which needs a lot of investment, but at the same time the underlying technology keeps changing rapidly (see my post herea long time back on the same topic).

We have seen the technology go from 2G to 3G to 4G to who knows what ( 5G is already being tested in labs and can do 1 gbps ). There is wifi, satellite or balloon internet and all sorts of communication tech coming up. Is it easy to predict what will be the shape of this industry in 2020? Doing a DCF analysis and putting a terminal multiple on the valuation of a telecom or similar company is sheer insanity.

The way to mitigate this risk is to have a very deep understanding of the particular industry, monitor the changes closely and not overpay for the stock. However if you do not have any specialized understanding of such an industry, it is best to stay away – discretion is often the better part of valor in investing

Commodity risk
This is the case where the price of a specific commodity drives the profitability of the business. This is obvious in the case of industries such as steel, metal, oil etc.

It was not so obvious in some other cases, till the commodity price dropped and hurt the industry badly. Take the example of jewelry/ gold loan companies.

These companies became the darling of the markets in the 2010-2012 period when the price of gold was going through the roof. A lot of these companies got a double boost from rising demand (due to rising gold prices) and from an increase in the value of their inventory.

Once the tide turned, some of these companies have struggled to remain profitable.

A similar story has played out in the agri space for seed companies (where the price of commodities have dropped) or mining firms.

One way to mitigate this risk is to evaluate a company over the entire business cycle and see if the company is merely the beneficiary of a lucky tailwind from rising commodity prices or will do well inspite of the commodity prices.

Capital structure risk
A company having a high debt equity ratio is generally a riskier company. What is ignored sometimes when evaluating this risk are the hidden liabilities which are the equivalent of debt, even though they do not appear as such on the balance sheet.

Take the example of tata steel and its pension liabilities or airplane lease and other fixed costs in case of airlines, which are a form of quasi debt.

The deadly combination is when some other form of business risk hits a highly indebted company. In such cases, the end result is often bankruptcy (atleast for the minority shareholders in india, promoters have no such risks)

How do you mitigate this risk? Learn to read the balance sheet carefully and understand all forms of fixed obligations which cannot be reduced even if the revenue goes down. Try to answer the question – How long will the company survive if its revenue dropped by 20%.

Valuation risk/ growth risk
This not a risk of the business risk. If you pay for the growth and it does not happen, then you are in trouble. An example which comes to mind is Hawkins cooker. A lot of investors continued to give high valuations to the company even when the growth slowed.

However once reality hit the market, the reaction was swift and sudden. As much as investors curse the management after such an event, I do not blame them for it. One can fault the management on not doing its best to deliver the highest possible growth, but then if growth is not visible, nothing stops an investor from exiting the stock for better opportunities.

There are several other companies (Which I will not name) which seem to be in a similar place – low growth, but high valuations. If we are lucky the drop in the multiple would be slow and gradual unless the growth picks up and justifies the valuations.

How do you mitigate this risk – simple, don’t follow the herd and think for yourself. If you don’t understand why a company sells for a high valuation, move on. Investing is not an exam paper where you have to answer all the questions to pass!

How to think about risks
Are you still reading? congrats !! you are true fan of this blog and also like to read boring stuff on investing J

It is easy to go on and on about risks and there are books on each type of risk. I cannot do justice to all of them in a single post. As an investor one has to evaluate all of these risk and more for each investment idea and identify which ones are the most critical.

Let me give an example – I used to hold Noida toll bridge company earlier in my portfolio . As I started thinking of the risks associated with the company, there were two key ones I was able to identify

Reinvestment risk: The company had been generating a good level of free cash flow, but had no opportunity to re-invest it. A company which cannot re-invest its cash flows is equivalent to a long dated bond and will get valued as such. Hence in this case, once the company reached its steady state cash flow, the future returns were likely to follow the growth in cash flow which was expected to be in the range of 6-8%.
  Regulatory risk:  The Noida toll bridge is a BOT project with an assured 20% return during the operation period (around 30 years). On top of that if the company did not make these returns in any year, the company could just carry forward the shortfall to the subsequent years. This meant that by 2011-12 the company had close 2000 Crs+ of shortfall on its books. The ground reality was that the Noida authority had refused to raise the tolls even by the level of inflation and every time they did, there were protests and dharnas. So the chance of realizing this shortfall was low.

The key point in the above idea was that the upside was limited and there was a regulatory risk which if it materialized, could completely destroy the investment thesis. So in a stroke of brilliance, after having held the stock for 2+ years and with a minimal gain, I decided to wise up and exited the company.

In July 2015, the management announced that company was re-writing the contract which would now end by 2031 and its likely the company will not be able to recover the prior shortfall. The stock dropped promptly as the market had assumed that company would be able to make up some part of this shortfall by an extension in the lease term or land development rights.


The above case is instructive of a variety of business risks. A lot of business risks are fuzzy and grey and one cannot put a precise number behind it. In addition, these risks do not materialize for a long time. However if one does materialize, the stock market is quite efficient in resetting the valuations promptly.

As an investor, you can ignore business risks at your own peril.


No mathematical precision
You would have noticed that I have not used any greek letters or volatility measures till now to measure the business risk. It should be quite obvious that these academic measures do not represent the risks for a company.

Think of the example of Noida toll bridge – did the past volatility of the company give any indication of the regulatory risk faced by the company?

The best one can do is to be aware and analyze these risks on an ongoing basis. If you are being compensated to bear this risk (in the form of expected returns), then you continue to hold the stock. If the returns are inadequate or if you think the downside from the risk will be too severe, then the best option is to sell and move on

My current approach to evaluating the risk is usually as follows

       I have a checklist of all the above risks and use it to evaluate which of these risks are relevant for the company I am analyzing.
       I try to dig deeper into the critical risks for the company and understand what are the key drivers and how it could hurt the company and its valuation
       My job as an investor is to evaluate the upside from the bull case of the company versus the downside from all the risks facing the company. If the downside risk seems too high, I will just move on to the next idea.

One final point – if this sounds complicated and difficult to implement, let me assure you – it is and will always be. The upside is that with an increase in competition for investment returns, this may still be an area where a hardworking and diligent investor will continue to have an edge over others.
—————-
Stocks discussed in this post are for educational purpose only and not recommendations to buy or sell. Please contact a certified investment adviser for your investment decisions. Please read disclaimer towards the end of blog.

Cheap and durable (price matters !)

C

Starting note: This is a long post and I am going to cover a lot of ground. I have tried to cover a vast topic in a few pages, which is usually the subject of entire books. As a result, I have tried to simplify and generalize in several cases to make a point.

In the previous post, I tried to make the point that it is not enough to say that a company has a moat and then rush to your broker to put in an order. One needs to answer a couple of questions

  • Does the company really have a sustainable competitive advantage or a durable moat? A high return on capital is a necessary but not a sufficient condition to demonstrate the presence of a moat
  • It is also important to judge the depth and durability of the moat. Deeper the moat and longer it survives, more valuable is the company

 Do not focus too much on the math

I received a few emails asking me about the calculations on how I arrived at the PE ratios. As I said in my previous post, the math is not important for the point I am making – longer a company earns above its cost of capital, higher is its intrinsic value.

I would suggest that you use the standard DCF model and apply whatever assumptions you like for growth, ROE, free cash flow etc and just play around with the duration of the moat or the period for which the company can earn above the cost of capital. It should be quite obvious that longer the duration, higher is the value of the company.

For the really curious, I have uploaded my calculations here. Prepare to be underwhelmed!

 Market implied duration

The other point i would like to make is by turning around the equation – If the company has a high PE ratio, the market is telling you that it expects the company to earn above its cost of capital for a long time.

For illustration, let’s take the example of Page industries (past numbers from money control, future numbers are my guess).

Future expected ROE = 50% (roughly 53% in 2014)

Future growth rate = 30% (40% growth in 2010-2014)

Terminal PE = 15

Current price = 14000 (approximately)

If I put in these numbers into DCF formulae, I get a Moat period of around 10 years.

So the market expects the company to grow its profit by 30% per annum for the next 10 years and maintain its current return on capital. This means that the company will earn a profit of  2000 crs by 2025.

So do I think that page industries will maintain its moat for 10 years or longer and grow at 30%?

I don’t know !

However if I did own the stock or planned to buy it, my next step would be to analyze the competitive strength of the company and see if the moat would survive 10 years and beyond, because if it didn’t I would be in trouble as a long term investor.

 Precision not possible

In the previous example I used a fancy formulae and a long list of assumptions to suggest that the market considers page industries to have a competitive advantage period or moat (CAP for short) of 10 years.

Once you put a number to some of these fuzzy concepts, it appears that you have solved the problem and are ready to execute.

Nothing could be farther from the truth.

Anytime someone tries to give you a precise number on intrinsic value of a company, look for the assumptions behind it. As you may have read, the best tool for fiction is the spreadsheet.

The above calculation should be the starting and not the end point of your thinking. I typically do the above kind of analysis to look at what the market is assuming and put it into three broad buckets

2-5 years : Market assumes a short duration moat

5-8 years : Market assumes a medium duration moat

8+ years : Market assumes a long duration moat (bullet proof franchise)

Let’s look at some way to analyze the moat and bucket it in some cases

 Measuring the moat

A substantial part of my post has been picked up from this note by Michael Mauboussin. The first version of this note was published in around 2002 and the revised one in 2013 (download from here)

If you are truly interested in learning how to discover and measure moats, I cannot stress this note enough (some important parts in the note have been highlighted by me) . Read it and then re-read it a couple of times. The only point missing from this note is the application of the concepts – Michael mauboussion does not provide any detailed examples of applying the concepts to a real life example.

 Model 1: Porter’s five forces analysis

I am not going to write a detailed explanation of this model – you can find this here. I have used this model to analyze IT companies in the past – see here. A few more posts on the same topic can be found hereand here.

Let me try to explain my approach using an example from the past. Lakshmi machine works was an old position for me (I no longer hold it). As part of the analysis, I did the five forces review of the company/ industry which can be downloaded from here

A few key points about the analysis

  • The entry barriers were quite high in the textile machinery industry. Once a company like LMW has established itself and achieved a market share in excess of 50%, it was difficult for a new competitor to achieve scale. A textile mill with only LMW machines finds it easy to maintain and repair these machines (due to accumulated learning) or get this done from LMW which has a large service network. LMW, due to a large install base, is able to provide a high level of service (network effect) at a low cost (due to scale of operations). So we have a case of positive loop here–  Largest company is able to provide a cost effective solution and high levels of service and still earn a good return on capital
  • The other factors such as Supplier power, substitute products etc are not critical to evaluate the industry
  • There is a certain level of buyer concentration, but the machinery segment has far higher concentration and hence the balance of power is still with LMW
  • Finally rivalry is muted as LMW has a level of customer lockin . A satisfied customer will prefer to continue with the same supplier (Who is also cost effective) as it allows it to achieve a higher uptime in operations and lower cost of maintenance (maintenance team needs to maintain only one brand of machines)

The above is also visible in the form of a very high return on capital for LMW – The company  had a negative working capital for 10+ years and earned 100% + on invested capital at the time of this analysis

As I analyzed the company in 2008, I felt strongly that the company had a medium (5-8) or a long duration moat. It was not important to arrive at a precise number then, as the company was selling at close to cash on books and the business was available for free. Surely a business with a medium term moat was worth more than 0 !

 Model 2: Sources of added value

The second mental model i frequently use is the sources of added value – production advantages, customer advantages and government (pages 34-41 of the note)

I have uploaded the analysis for CERA sanitary ware (current holding), I had done in 2011. Look at the rows 14-19 for the details.

A few points to note

  • The company enjoys scale advantages from demand, distribution, advertising etc. As the company gets bigger, these cost advantages would increase ensuring that the company will be able to price its product at the same level as its competitors and still earn a good profit
  • The company also enjoys customer side advantages from brand/ trademarks and availability
  • As you run through this checklist/ template, you will notice that a company could have either production or customer advantages due to various factors. However a company which has both has a powerful combination. If these two sources of value are working together and growing, then we may be able to say that the company has a medium or long duration moat
  • In case you are curious, I thought that CERA had a small to medium moat in 2011. This has expanded since then and the company most likely has a long duration moat now.

 Model 3: High pricing power

Another key indicator of competitive advantage is the presence of pricing power. The following comment from warren buffett encapsulates it

 “The single most important decision in evaluating a business is pricing power. If you’ve got the power to raise prices without losing business to a competitor, you’ve got a very good business. And if you have to have a prayer session before raising the price 10 percent, then you’ve got a terrible business.”

How do you evaluate this ? Look for clues in the annual report or management responses to questions in conference calls. Does the management talk of margins being impacted severely due to cost pressures ?

For example – Companies like Page industries or asian paints are generally able to pass through cost increases to customer without losing volumes. When the input costs drop they can either increase their margins or use this excess profit in advertising and promotions and thus strengthen their competitive position. Can steel or cement companies do the same ?

 Other miscellaneous models

  1. Is the competitive advantage structural (based on the business) or the management. An advantage based on the management is a weak moat and can change overnight if the same team is not in charge
  2. Industry structure : A duopoly or an industry with limited competition is more likely to have companies with competitive advantage. Look at batteries, two wheelers or sanitaryware for example. One is likely to find companies with medium or long duration moats in such industry structures.
  3. Govt regulation : This can be due to special ‘connections’. If you find a moat due to this factor, be very careful as this can disappear overnight

A brief synthesis

I have laid out various models of evaluating the competitive advantage of a company. Once you go through this exercise, you can arrive at a few broad conclusions

No moat: A majority of the companies do not have a moat. As you go through the above models and are hard pressed to find anything positive, it is an indicator that the company has no competitive advantage. Even if the company has been earning a high  return on capital in the recent past, it could be a cyclical or temporary phenomenon. Look at several commodity companies which did well in the 2006-2008 time frame, only to go down after that.

Weak moats : If the moat depends on single a production side advantage such as access to key raw material or government regulation, it’s a weak moat (think mining or telecom companies). The company can lose the advantage at the stroke of a pen, law or whims and fancy of our politicians. In addition the pricing power of such companies is very low. I would categorize such a moat as a weak one and not give it a duration of more than 2-3 years.

Strong, but not quite : If the moat depends on customer advantages such as brands or distribution network, the moat is much stronger. A company with a new brand which is either no.1 or no.2 has a much stronger moat. I tend to give the moat a medium duration (5-8 years). The reason for being cautious at this stage is that the company clearly has a competitive advantage, but the strength has not been tested over multiple business cycle. In addition, in some case the business environment is subject to change and one cannot be too confident of the durability of the moat. The example of LMW or CERA in the past is a good one for this bucket

The bullet proof franchise :These are companies with multiple customer and production (scale related) advantages. These companies are able to command high margins, can raise prices and at the same time have a very competitive cost structures due to economies of scale. These companies have demonstrated high returns of capital over 10+ years and continue to do so. In such cases, one can assume that duration of the moat is 10+ years. These cases are actually quite easy to identify – asian paints, nestle, Unilevers, pidilite, HDFC twins and so on.

Moats are not static

A key point to keep in mind is that moats are not static, but changing constantly. In some cases the moat can disappear overnight if it depends on the government regulation (such as mine licenses), but usually the change is slow and imperceptible and hence easy to miss.

If you can identify the key drivers of a company’s moat, then you can track those driver to evaluate if the management is strengthening or weakening the moat. For example, the moat of an FMCG company is driven by its brands and distribution network. As a result, it is important to track if the management is investing in the brand and deepening/ widening the distribution network.

In the case of LMW, I think the moat has slowly shrunk due to the entry of Reiter ltd. Reiter was the technology partner and equity holder in LMW. The two companies have since parted ways and Reiter is now competing aggressively in the same space.

LMW has repeatedly indicated that they are now facing a higher level of competition in India and consequently there has been a slow drop in operating profit margins. In addition one can see an increase in the working capital usage too. I cannot precisely state that the moat duration has shrunk from 10.7 years to 6.3 years, but there is increasing evidence that the moat is under pressure. As a result, I exited the stock a few years back.

Putting it all together

Let’s assume that you have done a lot of work and figured out that company has moderate moat possibly 5-8 years. At this point, you can plug in the required variables into a DCF model and analyze the market implied duration of the moat (the way we did for Page industries)

If the market thinks that the company has no moat or a minimal moat, than you have a probable buy. If however the market implied moat is 10+ years, then the decision would be to avoid buying the stock, not matter how good the company

The above sounds simple in theory, but is far more difficult in practice – I never promised that I will be giving you a neat, fool proof formulae of making a lot of money by doing minimal work 🙂

The moat of a long term investor

If the all of the above sounds too fuzzy and cannot be laid out in a neat formulae, you should actually feel very happy about it. Think about it for a moment – if something is fuzzy and requires a combination of a wide experience, insight and some thinking, it is unlikely to be done successfully by a computer or fresh out of college analysts.

Can a research analyst go and present this fuzzy thinking to his head of research, who wants a precise target price for the next month ?

So any investor who has a long term horizon and is ready to invest the time and effort to do this type of analysis will find very little competition. It is a general rule of business that lower competition leads to higher returns – the same is true for investing too.

If you buys stocks, the way most people buy shoes, TV or fridges – after due research on features, durability (how long the consumer durable will last) and then compare with price, the result will be much better than average

—————-
Stocks discussed in this post are for educational purpose only and not recommendations to buy or sell. Please contact a certified investment adviser for your investment decisions. Please read disclaimer towards the end of blog.


Patient Wealth creation

P

This is a commonly used, but rarely defined word. I am going to argue in this post that the sole purpose of investing is wealth creation.

What is wealth creation ?

Let’s take a numerical example. Let’s say you have 100 Rs. You can invest it in an FD at around 9-10%. At the end of 5 years, you will have around 161 Rs. We can call this the baseline level of return .

However putting money in a Bank FD is not a riskless transaction. If the inflation during this period turns out to be 11%, then you would have lost 5% of your buying power. On the other if we take the average inflation of the last 20 odd years, then the buying power would have risen by 15% over the same period.

Have you created wealth in the above case ? I would say yes, as you have been able to increase your buying power over the investing period, but not by much (15% at best on average).

Let’s say one were to invest in the stock market (via index funds) for a 5 year period. On average, the market has returned around 15-17% per annum over the last 20+ years. If you back out an inflation assumption of 7%, then the buying power would rise by 61% for the period. Now we are talking of some serious wealth creation !

However the above example has a catch – I spoke about an average return of 15-17%. The reality is that the stock market returns are lumpy and you can have a period of 2003-08 of 30%+ returns and then a period of 2% returns for the next 6 years (2008-2013). So in this case, one is talking of wealth creation with an added level of risk.

The above examples are quite obvious , but ignored by many. We need to concentrate on post tax, post inflation returns to evaluate the wealth creation potential of an investment option. If you have a higher buying power after taxes and inflation, then you have created wealth.

The aspect of time
I arbitrarily considered a time period of 5 years in my example. What is the correct period? 1 month, 1 year or 20 years?

I would argue that the time period for wealth creation should be driven by your personal goals. Are you saving (and creating wealth) for the purpose of buying a house or retirement? If that is the case, then the period should be upwards of 10 years.

Let’s put the above two point together – One needs to make a level of post tax, post inflation returns over the investment horizon (10 years +) such that you can meet your personal goals. Why else would you put your money at risk?

Now there a lot of people who invest for the thrill of it (for 100% return in days !!) or to boast of their investing prowess to their friends and impress the other sex , mostly women – who from my personal experience,   don’t care about such silly things  J ).

It is fine to put your money in the stock market to feel macho about yourself – but let’s not call that investing. Bungee jumping off a cliff is also done for thrills, but no one calls its investing !

Following the logic

If you agree that the purpose of investing is wealth creation over a long period of time, it is important not only to earn high returns, but to also do it consistently over a period of time. There is no point earning 30%+ returns for four years and then losing 50% in the 5th(Which will translate into an 8% annual return)

Why is consistency important ? If you can earn 15% consistently for 20 years, you will have 16 times your starting capital and 40 times if the rate rises to 20% per annum. This is simply the magic of compounding.

Now If you shift your focus from high returns (to feel good or boast about it) to consistent returns (to create maximum wealth), the investing approach changes.

Implication of consistent returns

If you are looking for above average, but consistent returns for the long run what should one look for ? If you are looking at earning a 15-20% return over a 10-20 year period , I would suggest looking for companies which are earning this kind of return on capital now and have the capability to do so for a long period of time.

If you can find a company which has a sustainable competitive advantage (sustainable being the key) or a deep and wide moat, then it is likely to maintain its current high return on capital. If you buy such a company at a reasonable price (around the median PE value for the company), the results are likely to be good over time.

Let’s look at an example here – This is a current holding for me and not a stock tip. The name is Crisil.

You can read the analysis here.
Following is a table of price, and annual return/ CAGR for the last 10 years

As you can see, even if you purchased the company on 31stDecember each year (blindly without worry about valuation), you would have done well.  This result boils down to the following reason

   The company has a wide and deep moat in the ratings industry due to government mandated entry barriers (none can just start a ratings agency),  Buyer power (Companies have to pay to get their debt rated and the cost is usually a small percentage of the debt) and lack of substitutes (even banks insist on company ratings now based on RBI directive).
   The deep and wide moat has enabled the company to maintain a high return on capital of 50%+ for the last 10 years. The company has been able to re-invest a small portion of its profits to fund its growth and has returned the excess capital to shareholders via dividends and buybacks.

A strong competitive position and good management with rational capital allocation approach has resulted in a very good result for the shareholders.

The catch
There always a catch in investing – nothing is as easy as it looks. For starters, this approach requires a huge dose of patience.

How many active investors (me included) would like to select a stock once in a few years and then do absolutely nothing  for a long period of time ? In every other profession, progress is measured by level of activity – except investing, where sometimes doing nothing is much better.

The other catch is that this approach is very boring. You find a few companies like crisil and then spend maybe 1 hr each quarter and a few hours every year end reviewing the progress. If the company is still performing as it always has, you have no further work left. If you are a professional investor, what are you going to do with the rest of your time ??

The last catch is that this approach has a level of survivorship bias. If you select a wrong company or if the competitive advantage is lost during the holding period, then the returns are likely to be poor or even negative.

Returns over entertainment
Although this ‘rip van winkle’ approach makes a lot of sense, I am unlikely to follow it fully. I enjoy the process of investing, looking for new ideas and doing all kinds of experiments. At the same time, a major portion of my portfolio is slowly moving towards such long term ‘wealth creation’ ideas.

In the final analysis, investing should be about wealth creation and achieving your financial goals.

—————-
Stocks discussed in this post are for educational purpose only and not recommendations to buy or sell. Please contact a certified investment adviser for your investment decisions. Please read disclaimer towards the end of blog.

Patterns of failure

P

Failure is a better teacher than success. This holds true in the case of investing too. I have been looking closely at some of the recent cases such as Arshiya international, gitanjali gems, CEBBCO, Kingfisher airlines, Zylog limited and some older ones such as reliance communications, DLF, SSI, aftek and many more.

These are extreme examples of spectacular drops in stock price of 80% and more. These examples are the exact inverse of multi-baggers and a few of such positions can decimate one’s portfolio. I have mostly been able to avoid such cases in the past (except SSI and zylog, which was self inflicted) and think it is important to avoid such extreme failure to make above average returns

Why analyze such cases? On that count, I am following these comments from Charlie munger on learning from failure

You don’t have to pee on an electric fence to learn not to do it
Tell me where I’m going to die, that is, so I don’t go there

It is not always fraud
I have seen an oversimplification on the cause of failure in the above cases. A lot of investors think it has been caused by management stupidity or greed. The reason for this conclusion is due to some high profile failures such as satyam.

It is easy to say that the management was unethical (Which is true in several cases) and hence the business failed. I think that is intellectual laziness. There are several other companies where the management is a bit suspect, but the company and its stock has not collapsed (though did not perform as well)

Some key factors
On going through all these companies, I am able to see some common threads. These factors may be present in combination in some cases or one of the factors could be dominant in others. In most cases, however it was the combination which sank the ship

1. Low return on asset/ equity due to commodity or highly competitive business (think airlines or telecom)
2. Low free cash flow (after taking into account Working capital needs and obsolescence risk/ business model changes )
3. Growth obsession funded by debt, resulting in high debt equity ratios (2:1 or higher
4. Cyclical industry with 1,2 and 3
5. Growth obsession with expansion into foreign markets (most likely from pricey acquisitions) stemming from management’s grandiose views of building an empire (rather than focusing on value creation)
6. Management failure/ governance issue (with diversion of funds into sister firms in some cases)

The steps to destruction
Let’s look at some kind of chronology of events leading to the eventual collapse in the stock price

1. Company experiences temporary success due to a cyclical high or tailwinds (look at the long term base rate to identify this situation). In some cases, success is from sales perspective and ROE and cash flows are still weak.
2. Management feels bullish and starts adding capacity/ businesses. In a lot of cases this is funded by debt or FCCB type equity.
3. In some cases, management goes abroad and acquires assets at high prices stemming from delusions of empire building (aka ‘Indian name’ in foreign lands)
4. Business encounters a hiccup or a cyclical downturn. The cash flows dry up and management finds it increasingly difficult to service the debt.
5. Management fudges the numbers for some time and tries to keep things afloat (bullish statements, confidence in the business inspite of worsening fundamentals such as negative cash flow, worsening debt service ratios etc)
6. The pack of cards finally collapses when the company defaults on its debt (openly or in private). When the market gets a hint of this, the stock price collapses almost overnight and the outside investor is left holding the bag

What to avoid
If you like the principle of inversion and think high cash flows and low debt is the sign of a healthy company, then one should avoid a company with poor cash flow and high debt irrespective of the story or future prospects (which are always rosy).
It’s quite possible, that you may miss some of the real turnaround cases, but on the balance I think it one would do much better by avoiding such companies

Bull market stocks
A lot of companies with poor cash flows and high debt did quite well during the previous  bull market and a majority of the investors choose to ignore the red flags. Why bother, when you are making money ?
It is during tough market conditions, that the chickens come home to roost, and a lot of investors (me included) get a lesson on risk.

—————-
Stocks discussed in this post are for educational purpose only and not recommendations to buy or sell. Please contact a certified investment adviser for your investment decisions. Please read disclaimer towards the end of blog.

How I think about macro

H

Charlie munger (warren buffett’s partner at Berkshire Hathaway) was recently asked about his views on macro and he said something to the following effect (in my own words)

“If thing are bad now, they will get better in time. If they are fine now, something will go wrong in due course. We don’t make money by predicting the timing.
At Berkshire, we’re trying to swim well against the tide or with it, we just keep swimming.”

If you have not heard or read about Charlie munger, I would suggest that you read up anything you can find about him. He is one the smartest and wisest person you will ever come across.

Ignoring macro ?
It was fashionable among value investors to completely ignore the macro till the crisis of 2008 – they spoke about it as a badge of honor.

The pendulum has swung the other way since then. I see a lot of investors being cautious about macro, to avoid a repeat of 2008.
 
I think macroeconomic thinking can be broken down into two elements

       Understanding  industry dynamics and trying to evaluate the long term economics of the company
       Understanding macroeconomic variables such as inflation, interest rates etc and trying to forecast or guess so as to make investment decisions.

The first element is crucial in understanding the company and its profitability in context of its industry. One needs to be aware of the competitive situation in the industry to be able to figure out the long term outlook for the company.

The second element which is generally reported on by media and guessed by an army of pundits, soothsayers, forecasters and talking heads is a waste of time. Very few, if any can forecast any of these variables with any level of accuracy and no one gets it right in the long run (remember oil was supposed to go to 200$ / barrel in 2008 ?)

The comment by Charlie munger should be seen in context of the second aspect of macroeconomic thinking – there are variables such as interest rates, exchange rate etc which can impact your performance, but as they cannot be predicted , it is far better to concentrate your energy on understanding the company and its industry and learn to live with the other aspects of macroeconomics  (interest rates, inflation, exchange rates etc)

The capital goods industry

Lets look at an example. The capital goods industry is going through one of the worst cylical downturns in the last 10 years. The last time the industy went through such as patch was in the 2001-2003 time frame (I remember those times !).

I don’t think anyone can predict with precision when the cycle will turn  (although a lot of people claim to be able to do so), but one can be sure that the cycle will turn eventually.

If you can understand the economics of this industry and can find some high quality firms at reasonable prices, I am sure the returns over the next 2-3 years will be good. Let me give a tip – Look at a company like BHEL or blue star or thermax and ask these questions

  • Are these companies likely to go out of business soon ? (current valuations seem to say so)
  • Is it likely that these companies will do well once the cycle turns ? (though we don’t know the exact timing ?)
  • Are these well managed companies with competitive advantages ? ( I believe they are)

The typical talking head on TV or broker needs to be right in the next 3 months. As an individual investor, I don’t have to play by the same rules. If I can find a company which will do well in the next 2- 3 years, I can ignore the near term outlook.
—————-
Stocks discussed in this post are for educational purpose only and not recommendations to buy or sell. Please contact a certified investment adviser for your investment decisions. Please read disclaimer towards the end of blog.

Facing the crash

F

The midcap index is down by around 7% since the start of the year and the small cap index is down by 9% during the same period.  That is quite a drop in a span of 45 days and it still does not represent the true carnage which has occurred in a few stocks which have dropped by 20% or more in the span of a few days.

The standard prescription

The standard prescription is to follow the fortunes of your companies like a hawk and to buy and sell the stock based on short term expectations. This approach helps you jump in and out of stocks and be ahead of the market at all times.

This prescription works well for highly cyclical stocks such as cement or steel where one needs to time the buy and sell decision to get above average results. The same approach is a disaster if applied to companies with above average economics (high return on capital with good growth prospects) at the hint of the slightest slowdown

I have personally paid the price for jumping in and out of stocks based on short expectations – such as with asian paints and marico (and more). I purchased these stocks in 2000 and sold them off in bits and pieces from 2006 and onwards.  The opportunity loss in all such cases has far exceeded the actual losses from all my failed stock picks

I won the battle (short term), but lost the war (long term).

How to handle such times
It is easy to preach rationality and follow it during times of rising markets. It is however a different ball game to be rational at a time such as now, when stocks can suddenly drop by 20% or more in a matter of a few days.

One way to prevent knee jerk reactions is to avoid checking your portfolio everyday.  One needs to turn off the financial channels and stop tracking the portfolio on a minute by minute basis. I really doubt the long term returns of one’s portfolio are dependent on any breaking news, which by the way is generally some useless piece of information

In addition to the above, one needs to have an appropriate level of diversification in the portfolio. I  general limit each position to around 5-7% in the portfolio to dampen the volatility. A higher level of concentration and the associated returns are thrilling when the market is rising. However during market swoons such as now, the momentum can suddenly turn and make a lot of individuals nervous. A focused portfolio is of no use, if you exit your positions at such times.

Finally, it is important to analyze the fundamentals of the company and try to look at it with a fresh mind after each quarterly result. It is important to avoid anchoring the thought process to the buy price and the original thesis and one should  look at the company based on the current price and its future prospects

What if I am wrong ?

One certainty about investing is that you will be wrong occasionally. The super investors are wrong less often than the less successful ones, but still make wrong bets.

In my case, if one of my picks crashes or the company comes out with a really bad set of numbers, the first thing I do is to avoid looking at the company for a few days – no I am not joking. The reason I avoid looking at the company is to prevent myself from reacting emotionally and taking a hasty decision. It is quite possible that I may lose 10-15% more on the position, but overtime I have realized that a calmer mind helps me in taking a more rational decision.

Once the panic dies down, I generally try to look at the results and key indicators of the business and try to see what I am missing (which the market sees). In several cases, I may conclude that the market is over-reacting and may decided either to do nothing or even add more to the position. Sometimes though, I have realized belatedly that I have messed up and  that the best course of action is to exit (and feeling like a fool at the same time).

A few months later, I will come back to the mistake again and analyse it further to avoid making the same mistake again (new ones will still happen!)

What next?
It is quite likely that things could get ugly before they get better. I personally have no way of knowing the future and my investment approach is not based on getting the short term right. I prefer to look at the 2-3 year prospects of the company and if the company is moving in the right direction, I would rather just buy and hold the stock (or buy more if the stock gets cheaper).

Falling off the cliff

F

You may have heard about the fiscal cliff drama in the US. We have some companies which have already gone through their own version of the cliff

Look at some of the price action below


As you can see in  these two cases, the price has dropped by 75% or more in the last 6-12 months. I normally ignore fluctuations in stock price, as most of it is noise. However a drop of 75% or higher is a signal that something fundamental is happening.
Why analyze failure

The question is why bother to analyze such cases? I subscribe to the philosophy that if one wants to be a good investor, then one should study and learn from exceptional success and failure. One should not only analyze companies which have done well in the past (such as Hawkins or titan), but also look at the companies which have destroyed a large amount of shareholder wealth.

The best reason for analyzing failure is illustrated by the phrase – invert, always invert, by Carl Jacobi who said that one of best ways to solve some problems is by inverting them.
As Charlie munger has said, if you want to succeed, learn to avoid failure. If one can identify why the above companies dropped off a cliff, one can use that learning to avoid such cases in the future.

Is it all fraud?
It is easy to ascribe the drop to some kind of fraud (as it happened in the case of satyam) and avoid any further analysis. I think that is intellectual laziness and will not help us learn anything.
I would like to put the above examples in two buckets

  1. Attractive core business, with management diversifying into poor businesses with heavy leverage
  2. Mediocre core business with poor cash flow resulting in high debt

Poor diversification and failure of corporate governance
You can read the story of Deccan chronicle here. In a nutshell, the company had a very profitable core business – newspapers and diversified into loss making ventures such as Deccan charges, retail ventures etc.

Over time these cash guzzling businesses consumed the entire cash flow of the core business and more , resulting in high levels of debt on the company. The management on its part, hid the problems and the extent of the debt from the shareholders. When the same was disclosed, the stock price collapsed.

It was not easy to see this problem coming (atleast to me) as the annual report as late as 2011 did not display any kind of serious problem. We had a failure of corporate governance and lack of appropriate disclosures (fraud or not, I am not sure).

Weak core business

The case of zylog systems is different. If you read the past annual reports, you will be able to see that the company has not been generating adequate free cash flows and has funded the high levels of growth via debt. The ‘cliff’ seems to have happened due to the following events

  1. poor operating performance resulting in cash flow problems (in addition to commoditization of the core business)
  2. Cash flow problems resulting in higher debt which was taken to fund the growth
  3. higher debt resulting in promoter pledges to get the funds
  4.  Point a. causing the stock to drop, resulting in margin calls and forced sale of the pledged stock.
  5. The forced sale, causing further steep drop in the stock price

Difference between the cases
Although the end result is the same (as of today), the underlying cause is different. In addition, it is easier to identify companies with a weak core business (and high debt and promoter pledge).

In comparison, companies like Deccan chronicle had a healthy amount of cash on the balance sheet until it suddenly became known that there were a lot of hidden issues (and debt). Such companies are more difficult to identify and one is likely to only get some faint signals that there is something out of place.
Learnings

So what can one learn from the above cases ? Let me share mine

  1. Follow the cash flow, ahead of the profits. If the company is showing a high level of growth, which is increasingly funded by debt, one should get cautious. It is a time bomb, which can blow up if things don’t play out as planned.
  2. Poor Capital allocation – if the management is investing in all kinds of ventures with a history of poor profitability, then one should avoid such companies . These kinds of decisions eventually catch-up with the company.

Disclosure : Have invested a tiny amount  zylog from a tracking perspective.  Please make your own decisions and read the disclaimer

Subscription

Enter your email address if you would like to be notified when a new post is posted:

I agree to be emailed to confirm my subscription to this list

Recent Posts

Select category to filter posts

Archives