CategoryInvestment process

Looks can be deceptive

L

Following is from a note published to subscribers. Hope you find it useful

It may appear that our outperformance is from how well we do in an upcycle. That is not entirely true. let me share some stats

Losing less than the indices

I have no preference for any particular market cap but tend to avoid the smallest companies from a risk and liquidity standpoint. Outside of that, any company is fair game for our portfolio

If you look at the table above, one period of outperformance stands out. In 2018 and 2019, when the market went south, we lost much lesser than the market

We were outperforming when it did not appear that way. Losing less than the market in bear markets is also an achievement, even though it may not appear to be. Some of the subscribers who joined us during this period, threw in the towel before the market turned as they did not agree with that notion.

The period of 2018-2020 was not an easy one. I made some of the worst mistakes of my investing career –  Shemaroo, Edelwiess Financial services and Thomas cook (sat on it for too long). These losses are seared into my memory. When you lose your own money and that of your family, it is not easy to forget

In spite of these mistakes, we lost much lesser than the indices. The key was to keep our heads down, keep working and wait for the tide to turn. It was also important to have some extra cash in place

Regular theme

The last few years are NOT an aberration. This has occurred regularly, and it will occur again. You can take the following as a given

  • We will lose money from time to time, at individual stock and portfolio level, even though I am focused on not losing money, which includes my own
  • There will be long stretches of underperformance with sudden spurts of outperformance
  • Returns will be lumpy and unpredictable
  • If you do not have the patience to stick around, you may exit at the wrong time

Let me share another metric to underscore my point

The model portfolio is up around 50% from 15th Jan 2018 to 30 Jun 2021. What is special about these two dates? The small cap index peaked on first and then went into downturn. It regained this peak again this year.

We are up 50% from peak to peak

The key is to evaluate performance is to do it over a cycle and not from the bottom to the top of a cycle (when everyone looks like a genius) or from top of a cycle to the bottom, when any outperformance is hidden

The Momentum mindset

T

From my recent note to subscribers

I have spent the last 9-12 months digging deeper into other approaches to investing. I have read up on the momentum style, technical analysis, trading, options and more. The reason was to understand how other investors think

It is easy to become dogmatic about your approach and think only you have access to the ultimate truth. I have been guilty of that. I have seen a few value investors (including friends) talk about these other approaches and that intrigued me to dive deeper.

It has given me a better appreciation of these other styles and understand (NOT predict) the price movement in stocks much better.

I have defined my approach as value investing – buying companies for less than their intrinsic value and then holding them for the long term (2-3 years).  This approach involves deep analysis of the business and its prospects. However an under-appreciated aspect of value investing is the time horizon.

Value investing or in other words convergence of price to value of a company, usually happens in 2+ years. In the short term markets are quite efficient and tend to price the near term quite well. The gap (if there is any) usually closes over the long run.

The approach is sound and has worked for a long time. What has changed ofcourse is the definition of value. If you still follow the traditional approaches of PE, P/B ratios and so on, then you will not do well as markets and economies have evolved a lot in the last 15-20 years.

In comparison, other approaches such as Momentum (where you buy stocks which have done well recently in terms of price performance) have worked quite well in the recent past. This approach is practiced more widely in India and there are a lot of very successful practitioners. The difference however extends beyond just the approach. It also involves a shorter time horizon and a difference in temperament.

Although the upside is good, this approach comes with its own risk in the form of momentum crashes. Investors who practice this form of investing have a methodology (rules based or otherwise) to exit their positions when the momentum turns to reduce the downside.

This often means changing your view and portfolio positions overnight. It is important to recognize which approach fits your temperament and which positions make sense for it. The worst thing to do is to buy a momentum stock with a value investing framework.

The momentum mindset

Even though I am not picking stocks based on momentum (yet), I want to build that mindset into my decision making process. The trading or momentum mindset is more rational, even more so when it is rules based.

Investors who follow the non-discretionary approach in momentum or trading, exit their positions when their system gives the signal to do so. Their effort is to back test the system and validate it. However once that confidence is developed, it is followed with discipline.

On the contrary investors like me, tend to get wrapped up too much with our narratives (or stories). As result, even when external conditions change, we tend to stick to our outdated stories and refuse to exit the position.

I have been guilty of this and even when I do change my mind, tend to get emails accusing me of abandoning a stock as if we should remain married to it forever.

I have been re-thinking my approach and you could see a higher turnover or exits even where I was optimistic or positive earlier. Some of you will hate me for taking small losses when I am wrong. I will treat that as an occupation hazard.

It is far better to take a small loss initially than lose much more later.

Stress testing the portfolio

S

< Company names and details of the same have been removed>

To all subscribers,

I have been asked about the impact of the ongoing epidemic (Covid19) on our portfolio companies. I have been doing this analysis and this note is to describe the process. This is a probabilistic exercise which depends on the following factors

  • How long will the lock down last?
  • Will the lock down be lifted in phases (both in terms of time and geography)
  • How will this event impact consumer behavior (short and long term)?

All the above factors are important, but unknowable for now. We have a range of guesses floating around with unknown probabilities. Instead of trying to guess what is going to happen, I have tried to analyze this situation in a different fashion. I have broken down the problem into three-time buckets with a specific set of questions for each bucket

Short term bucket (3months)

  • Does the company face bankruptcy risk (due to zero revenue)
  • What is the liquidity situation for the company? In other words, does the company have enough cash/ access to credit to tide over this period

Medium term bucket (3-9 months)

  • What is the break even revenue for the company at which it can it can sustain its manpower expenses and mandatory overheads (rent, power etc)

Long term bucket (> 9 months)

  • Is the long term demand for the company impacted by this event?
  • Will the consumer behavior change permanently such that the company’s business model will be impacted?

The above questions are crude approximations and I am not trying to come up with a numerical impact on fair values. I have seen some analyst reports where they have changed the target price by X%. Putting a number, does not change the fact that this is still a guess.

Some of the conference calls by company managements show that they are also grappling with the unknown and do not have visibility on the numbers. To assume that an outside investor can do better is silly.

I have evaluated these questions using the following data points

  • Liquidity risk/ Credit report from ratings agencies
  • Company annual reports/ financial statements to evaluate how long the company can survive with zero revenue and the level of topline needed for break even
  • Management commentary

The stocks in the model portfolio are arranged based on their risk profile. This sequence is again a rough approximation of the risk. What this means is that company 2 is not more risky than Company 1, but Company 2 has lower risk than Company 14 which is at the bottom of the portfolio.

Dynamic situation

The impact on each company will depend on how long the lockdown lasts, whether it is consumer facing and the fragility of its balance sheet. In our case, most of our portfolio companies (other than financials) have low to zero debt. There is only one position which has high debt levels and is exposed to the consumer. As a result, this company is the lowest in the model portfolio and has been on hold much before the current situation (old subscribers including me continue to hold it).

I will be addressing a few more topics in my next post with the above framework in mind.

Avoiding failure

A

The following is from my annual letter to subscribers. I will be posting the letter soon on the blog

There are a few irrefutable statistics of the India stock market. Over the last 10-year period around 50% of small caps (and roughly the same for midcap), lost money for their investors. Only 10% of the companies in this space accounted for most of the returns of the index.

In such a scenario, rejecting stocks is an equally important task in building a portfolio.

We have been focused on this aspect from the beginning of the model portfolio but have not discussed it in depth. The last two years has brought this factor into the spotlight and I want to share the process we use to filter ‘out’ stocks.

The first step in filtering out stocks is quite simple. I look at an idea and reject it if any of the following conditions are met

  1. Management has past record of illegal actions or are known for bad governance practices. This is a subjective criterion, but one can filter out the obvious cases
  2. Debt equity (other than financials) is greater than 1.5
  3. PE is greater than 60
  4. Company operates in an industry with poor economics (return on capital over a business cycle has been below 5%)
  5. IPOs

Some of you may look at this and point out that ‘so and so’ company has been a value creator in spite of meeting some of these conditions.

To this my response is this – An elimination process works on probabilities. If you pick 100 companies which have a very high PE or very high debt, 80% or more will lose money for their shareholders. There will always be some which buck the trend.

I am not trying to win an intellectual contest of picking a winner with odds stacked against it. If you play this game long enough, the probabilities eventually catch up with you.

If the idea survives this step, I move on to the next series of checks. These checks are detailed out in the spreadsheet I upload for every company. I have extracted the specific sections used to reject an idea and uploaded here for reference.

Please keep in mind these checks are not quantitative and there is no mathematical formulae which will throw up an answer. Think of these points as checklist/questions to dig deeper into the company

  1. Fragility – I added this section recently and use it to check whether the business would collapse if some of these risks materialize. For example – Does the company have a major concentration with a single customer or supplier. What will happen if this partner pulls out?
  2. Management checklist – I have had this section for a long time and have added to it over the years. There are sub-sections to check if the management actions have been ‘suspect’ in the past and point to unethical behavior
  3. Accounting – This has an exhaustive list of possible accounting games companies play. I have created this from multiple books on financial fraud and accounting malpractices. 2018/19 had a few repeats and some new ways of fudging accounts
  4. Risk analysis – I added this section a few years back and it is for a deeper analysis of risks and their probabilities.

As you can see from the file, this is a checklist to ensure that I don’t miss something obvious. At the same time, this will not prevent mistakes from happening. A management may be able to hide some of its behavior for a long time and it may come to light after we make an investment.

These points are not black and white and involve a judgement call on where to draw the line. In the past, I have been more tolerant of management behavior, but have realized that even if a particular idea works out, the long term average of such decisions will be disappointing ( I have called this riding a tiger in the past)

As you will note, this process works on evidence or past history of a company and its management. If that is missing, we are flying in the dark. This is another reason for me to avoid IPOs. In most IPOs, the business has been dressed up for sale and all the skeletons tumble out after the listing.

The aggregate performance of all the IPOs in the last 2 years bears this point. Pointing out a few successes, only proves that they are the exceptions and not the rule.

The downside of this process is that I may end up rejecting a company which turns out to be a success. I am comfortable with that problem as long as I can avoid failures. A portfolio of 20 companies out of a universe of 3000+ stocks means that will we miss a lot of winners.

The more important criteria is to avoid the losers.

End of the promoter put

E

Let’s look at the most basic of accounting equations (simplified)

Shareholder equity + Net Liabilities = Net assets

Net liabilities in this case are the on-balance sheet items such as debt, Account payables etc. In addition, there are also some off-balance sheet items such as contractual lease payment, accrued compensation etc. On the asset side, we have the obvious assets such as fixed assets, current assets and cash.

It’s an axiom or truth that the above equation needs to balance out. However, the Indian markets have long violated this axiom. There have been several instances where promoters created dubious or nonexistent assets via debt, defaulted on the debt and were still able to keep equity/ control in the firm.

This is slowly becoming a thing of the past.

The recent introduction of IBC and formation of the NCLT, means that once a company defaults on its debt, the debt holder can take the company to the bankruptcy court. Once that happens, the court can liquidate the firm (sell all the assets) and re-pay the debt holder. Whatever is left after paying all the debt and other claimants, is available to the equity owner.

In the past, the promoter could arm twist the debt holders and thus retain the value of equity. This is no longer possible now.

The 1934 edition of security analysis by Benjamin graham, long considered the bible of value investing, cover bankruptcy and net asset type of investing in detail. After the 1930s depression in the US, a lot of firms were available for less than net asset value (net value after deducting all liabilities). An enterprising investor could take control of such a company, liquidate all assets (often at a discount) and make more than the amount invested.

Although the concept holds true, that world no longer exists today. Most companies create value based on intangibles such as customer relationship/ brands etc. The tangible assets on the book are not worth much as standalone assets and even less in a fire sale. In most bankruptcy proceeding such assets sell for 20-30% of book value.

There have been exceptions to the above in case of some steel companies where assets have sold for 60%+. If you take most other companies in bankruptcy proceedings such as Jet airways, the assets on the book will fetch not more than 30-40% of their value.

If the above numbers are valid, then in most cases, the debt holder takes a haircut and is able to make 40-50 cents on the dollar if the business remains in operation (under a different management). If the business is liquidated, then the recovery is even less.

In all these cases, the equity holder gets nothing at all.

Hypothesis and bets

H

I recently wrote this note to subscribers as part of a company analysis. I have removed names for obvious reason, but the point I am making remains valid.

—————

This is a good example of how most ideas work (if they are successful). It takes time and patience to stick around for a thesis to play out. The stock market is an efficient place and one should not assume that other investors are idiots. In most cases the market is right and is discounting the near-term results into the price. As a result, it may undervalue a company which has good long-term growth prospects but is facing temporary challenges.

The job of an investor is to evaluate if the challenges are temporary or permanent. If you think it is temporary, then it makes sense to start investing into the company via a small position. The reason for starting with a small position is to be open to the possibility that one is wrong about the hypothesis.

I have a reason why I always use the word hypothesis. It has a precise meaning. It does not mean a forecast or a guess. It means possibility or ‘what can happen’. The future is always indeterminate and as an investor one needs to consider the range of possibilities.

Think bets

This means that one starts with a small bet and raises the bet as more data comes in. This is the equivalent of starting with a small bet in poker and raising your hand as new cards open up (information comes in). If the data or cards do not fall your way – you fold your hand or sell out of the position.

If you have watched poker, you would have noticed that even the best players fold a lot of hands when they realize that the cards have not come their way, or they have made a mistake. Investing is similar. If you have made a mistake or data comes in such that the negative scenario appears more likely, then you reduce the size of the bet or fold your hand.

On the contrary, If the data starts pointing to the optimistic scenario (growth is returning back, ROCE is improving etc), then we start raising the size of the bet or in other words our position size.

This is what I am doing all the time – taking an initial position with a few hypotheses in mind and then raising or dropping the position size based on how the company performs or how the data comes in.

In some cases, the favorable scenario (which in my view has a higher probability) works out. In the case of company X, as growth returned we have raised the position. In some other cases, the growth and improvement in economics is yet to happen – we have kept the position size the same. In a few cases, if things worsen or if I am wrong, we drop or eliminate the position.

Right expectations

Why I have taken this detour in the quarterly update? I have sometimes received emails expressing surprise that I have turned pessimistic after sounding positive for a long time. In all these cases I am watching the company and industry and as the data changes or some events occur, I have changed my view of the company (sometimes late).

How else should one react? Should I just stick to my view so that I appear all confident and smart while I drive our portfolio and capital over the cliff? For our collective sakes, I hope that I can avoid my ego from getting in the way of making rational decisions. In the past, I would fret about it. Now, I just ignore and take the necessary decision irrespective of how I appear to others.

As a side note, there is another pattern you should observe. As the market discounts the next 1-2 years performance correctly, it means that the minimum time it will take for an idea to show results has to be more than that. In 2017, the market was discounting 2018 and early 2019 performance for Company X. As growth improved for FY19 and FY20, the market has taken note of it and started discounting the same.

Discounting hope

D

It is widely understood that stock prices are forward looking – they discount the future expectations of cash flow of a company. In bear markets, these expectations are lowered as markets extrapolate recent trends (and assume a recession forever). On the flip side, the reverse happens during bull markets, when investors extrapolate the recent good results into the future and assume that there will be no hiccups along the way.

Finally, we have markets like now, where investors have gone ahead and extrapolated ‘hope’ and discounted that too.
The idea funnel

I maintain a 50+ list of stocks which I track on a regular basis and have created starter positions in a few companies which appear promising. The process i follow is to create a small position (usually 0.5% to 1% of my personal portfolio) and then track the company for a few quarters/ years.

In atleast 50% of the cases or more, I realize over time, that I am not too excited about the prospects of the company and exit the stock immediately. In a few cases, however the company and its stock may still hold promise. In such cases, I start raising the position size in the portfolios I manage.
The above approach allows me to run experiments with lots of ideas and controlled risk.
Discounting infinity and beyond

I am now noticing that some of the positions I hold on a trial basis have started running up based on hope.

Let me take one example to illustrate – Repro India.
Repro India is a printing business with operations in India and Africa. The company performs print jobs for publishers for all kinds of printed materials like books, reports etc. The company has had a chequered past with uneven performance. 
The company was growing till 2012-14 with rising sales in India and Africa. The return on capital of this business was mediocre as the printing business involves high fixed assets, high and sticky receivables with average operating margins in the range of 15-18%.
The export business in Africa went into a nose dive in 2014 due to the drop in oil prices. The company was not able to collects its receivables as these African countries faced currency issues and hence incurred losses. Since then the company has been slowly recovering the receivables and nursing the business back to health. In addition the domestic business continues to be competitive and sub-optimal due to the lack of any competitive advantage
I would normally avoid such a company unless there are some prospects of improvement or change in the future. One such possibility exists for the company. This is the new BOD – books on demand business of the company.
The BOD business is similar to an aggregation model followed by companies such as uber or Airbnb. In the case of repro, the company has a tie up with Ingram (another US based aggregator) and other publishers in India to digitize their titles and carry them on its platform. These titles are then made available through ecommerce sellers such as Amazon or flipkart. When a user like you and me finds this title and purchases it, Repro prints the copy and delivers it you.
The business model is depicted in the picture below (From the company’s annual report).
The above business model ensures that there is no inventory or receivables for Repro or the publisher. The payment is received upfront and the product is delivered at a later date. This is a win-win business model for all the value chain participants as it eliminates the need for working capital. As a result, this business model is able to earn a high return on capital with the same or lower margins than regular publishing
Illustration from the company’s annual report

Repro is doing around 40-50 Crs of sales in the BOD segment and growing at around 70-80% per annum. The company has loaded around 1.4 Mn titles on its platform and plans to load another 10 Mn+ titles in the future. This business is at breakeven now. The BOD business has a lot of promise and it’s quite possible that the company will do well. 
However, success in the business is not guaranteed. The company needs to scale its operations and could face competition from other print companies in the future (as the entry barriers are not too high).
The market of course does not care about the uncertainty. There are times, when markets refuse to discount good performance in the present and then there are time like now, when the market is ready to discount the ‘hope’ of good performance in the future. The stock sells at around 100 times the current earnings. As the legacy printing business continues to be mediocre with poor economics, it is likely that the high valuations are mainly due to the exciting prospects of the BOD business
I had created a small position a couple of months back and have been tracking the company. The stock price has risen by around 50%, 60% since then even though the company is just above breakeven on a consolidated level.
I am optimistic about the prospects, but the execution needs to be tracked. I am not willing to pay for hope and so I am a passive observer for now.

—————-
Stocks discussed in this post are for educational purpose only and not recommendations to buy or sell. Please contact a certified investment adviser for your investment decisions. Please read disclaimer towards the end of blog.

A statistical analysis of failures

A

I have often written about experiments and failures in the past (see here, hereand here). These posts have usually involved a failed experiment or idea and my conclusions or learnings from it. It has been a case of inductive reasoning (going from the specific case to general principles).

I recently initiated an exercise where I collated all the investments I have made since 2010/11 and analyzed the success rate of my picks. I have defined failure as a stock position which delivered less than 13% CAGR over the last 5-6 years.

Why 13% and not an actual loss? There are a few reasons behind it

   13% is roughly the level of returns one can expect from an index and hence I have set that as the threshold
   It allows me to capture value traps as failures. These are stocks where the stock price has stagnated or trailed the index as I waited for valuations to revert to the long term averages.

The analysis was quite eye opening and although I had some vague idea of what to expect, the actual results were still surprising.

Surprisingly low hit rate


I have bought/ sold or held around 35 position in the last 6 years. Of these, I have lost money in 7 and consider 16 (or 45%) as failures (<13% category also includes the < 0% cases)

If you look at the above result, the conclusion could be that the overall portfolio has performed horribly. I am not going to share the actual results as that is not the purpose of the post and anyway I can claim anything in absence of independent verification. Let me just share that the portfolio has done substantially better than the common indices (substantial being 10% above the NSE 50 returns)

A common myth is that high returns need a 90%+ success rate (if not 100%).

The reason behind the myth

So why does almost everyone believe that one needs a perfect hit rate to achieve good returns? This myth is quite common as one can see from comments in the media, where people are surprised when some well-known investor has a losing position.

I think it speaks to the ignorance of the following points

   A losing position has a downside of 100% at the most, but a winning position can go up much more than that and cover for several such losses. Let’s say you have a portfolio of three stocks and two go to 0, but the third stock is a 5 bagger. Even in such an extreme example, the investor has increased his portfolio by 50% with equal weightage in all the three positions.
  Let’s take the previous example again and instead of equal weightage, let’s say the two failed position were only 10% of the portfolio, whereas the winning position was 90%. In such a happy scenario, the overall portfolio is up 4.5X.

In effect investors under-estimate the impact of upside from a winning position and the relative weightage of these winners. A portfolio is not like a true or false exam where every question gets the same marks. If you get something right, the weightage and extent of gain on that position matters a lot

So the next time, you read an article where some famous investor lost money on a position and chalk it to them being over-rated, keep in mind that the losing position could be a tiny starter position. A lot of investors sometimes start with a small position and then build it as their conviction grows.

The learnings

The main reason for this exercise was not to generate some statistics and leave it at that. I wanted to dig further and find some common patterns of failure. This is what I found

Blind extrapolation
The number no.1 failure for me has been when I assumed that the past performance of a company or sector would continue and hence the recent slowdown or poor performance is just a blip.

For example, I invested in a few capital good companies in 2010/11, assuming that the recent slowdown was just a blip. These companies appeared very cheap from historical standards and that motivated me to invest in some of them. I did not realize at the time, that the country was coming off a major capex boom and it usually takes 5+ years for the cycle to turn.

I have since then tried to dig deeper into industry dynamics and understand the duration of the business cycle of a company in more depth.

The forever cheap or value traps
These positions are a legacy of my graham style investing. These companies appeared very cheap by all quantitative measures. I would attribute the failure of these positions to the following reasons

These companies were earning low returns on capital as the management had very poor capital allocation skills. To add insult to the injury, some of these companies refused to increase the dividend payout and just kept piling cash on the balance sheet. In all such cases, the market took a very dim view of the future of the company. Unlike the developed markets, India does not have an activist investor base and hence these companies end up going nowhere.
  I forgot to ask a very basic question: Why will the market re-value this company? What needs to change to cause this revaluation? In most of these cases, the company performance was not going to change substantially for a variety of reasons, and hence there was no reason for the market to change its opinion.

The turn which never happened

There have been a few positions where my expectation was the company will start growing again or will improve its return on invested capital (or both). In all such cases, the expected turn never happened and the company just kept plodding along with me incurring an opportunity loss during this time.

The problem with these kind of situations is that you don’t lose money due to which one is lulled into complacency. One fine day, after having waited for a few years, I realized belatedly that I was waiting for something which was unlikely to ever happen.

I have now changed my process to identify the key lead indicators for a company which need to change to confirm that the management is moving in the right direction. For example, is the management introducing new products, expanding distribution or trying something else to revive the topline? If the annual report and other communication continues to be vague on these points, it is best to exit and move on

Doing too much

There is another pattern I have noticed which is not obvious from the table. I have had a higher number of failures after a successful phase. I think this is most likely due to over confidence on my part which led to a higher number of new ideas in the portfolio with much lesser due diligence on each of them. The end result of this sloppy work was a much higher failure rate.

The changes

It is not sufficient to just analyze failure. One need to make changes to the process in order to prevent the same error from occurring again

Some changes in my process/ thinking has been

–  It is difficult to invest in commodity/ cyclical stocks (atleast for me). I should tread cautiously and have a very strong reasoning behind such an investment (being cheap is not enough).
–  Identify the reasons on why a company will be re-valued by the market. Also have a time frame attached to it (endless hope is not a strategy)
–  Be your own critic. Confirm if the original thesis holds true? If not, exit. It is better to be proven wrong as quickly as possible.
–  Growth is not all important, but absence of it can lead to a value trap.
–  The most dangerous phase is right after a successful stretch. Resist the urge to extend your lucky streak by making investments into half-baked ideas. Take a break or vacation!

If there is one lesson from the above analysis you should take, it is that one does not need to have a very high hit rate to get decent returns. As long as one holds on to companies which are doing well and culls the poor performers rationally, the overall results will be quite good.

—————-
Stocks discussed in this post are for educational purpose only and not recommendations to buy or sell. Please contact a certified investment adviser for your investment decisions. Please read disclaimer towards the end of blog.

The search for a free lunch

T

Ask any serious, long term investor on the type of company he or she would like to invest and you will almost always hear something along the following lines – A high quality company with sustainable competitive advantage (aka Moat) and long term growth prospects, available at a cheap or reasonable price

So what’s wrong with the above statement? It’s almost a truism and a guarantee of great results ….

This is a long post and I am trying out a new approach. Instead of posting the entire post with all the headache around the formatting, I have converted it into a pdf. please download this post from below

The search for a free lunch

——————————————————————————————————————————-Stocks discussed in this post are for educational purpose only and not recommendations to buy or sell. Please contact a certified investment adviser for your investment decisions. Please read disclaimer towards the end of blog.


Not everything that counts, can be counted

N

In an earlierpost, I wrote about the two types of risks faced by an investor – risks faced by all investors irrespective of the nature of the investment and business risks associated with a particular investment.

In this post, I will try to describe a variety of business risks and how I use it via a checklists to further evaluate a business. The list I present below is by no means comprehensive (as I am not writing an academic paper) and just represent the ones I have faced in the past or can think of as I write this post.

Advance warning – this is a long post even if it is not comprehensive and there is no silver bullet or blue/red pill at the end to make investing easier.

Regulatory risk [earning excess returns from favorable regulations]
If a company is able to make above average profits due to a favorable regulation, then it is exposed to this risk. For example, think of a banking license or the right to supply natural gas to a specific geography such as Delhi in the case of indraprastha gas.

In these cases, the company has a pseudo monopoly due to a favorable regulatory position. If the terms of the regulation changes, the company could find that the economics of the business has worsened or worse, it no longer has a viable business at all.

There are a lot of examples of this kind of risk. For example, PNGRB – the gas regulator announced in april 2012 that they had the authority to fix gas prices and asked IGL to drop its price by 50%+. The company lost more than 50% of its value after the day of the announcement and since then has recovered most of it, after the supreme court overturned the decision. In spite of the favorable response, an investor in this stock has done worse than the index during the same time period.

The same story has played out for several companies in the mining space after the Supreme court order banning iron ore mining due to the illegal mining problem in some states. This kind of risk is critical in the case of telecom, power, finance and other heavily regulated industries.

The key point is this – If the business model of a company depends on specific regulations, then the company is always exposed to this kind of risk. . The company could be doing well for a long time and then suddenly the regulator or the government can change its mind and put the entire business at risk.

I have noticed that the market is usually sanguine about this risk and it is generally not priced in. However if the risk materializes, the reaction is swift and brutal. The only way to mitigate this risk is either to avoid such companies altogether or hope and pray that the regulator/ government does not change its mind on the key regulation.

Reputation risk [earning excess returns based on reputation/ brands ]
This is a key risk in those businesses which depend on the reputation of a brand or a company. If the company earns an above average profit due to a favorable image or brand position, then it is very important for the company to safeguard the brand.

In the event that there is some incident where the brand image is impacted, the management should react swiftly and prevent further damage to it.

Case in point – Maggi from nestle.  Irrespective of the merits of the case, the response of the company to the whole lead content issue and subsequent recall was appalling. The issue surfaced in April and the company finally responded in June when the issue blew up in the media. This is a 1.2 Bn dollar brand and the management did not react to the situation till it finally got out of hand.  Net result – The company lost close 20% of its market cap in the aftermath.

This risk is critical when the company you invest makes money based on the power of its brand and trust. The only way to mitigate this risk is to have a management which reacts promptly if it sees a risk to the reputation of the company or its brands.

Management risk [Poor quality management]
This is a risk commonly understood, accepted but least followed by a lot of investors. If you talk to someone who has been investing in the markets for a period of time, they will agree that it is important to invest only with a high quality management.

Lets first define what is high quality which I like to think of on two parameters

Capital allocation and distribution – does the management allocate capital at high rate of return in the business and distribute the excess to shareholders via dividends?

Ethical behavior towards all stakeholders – Does the management behave ethically or treat other stake holders (such as customers, employees, shareholders etc) in a manner they would like to be treated if the roles were reversed?

The first parameter is quite objective in a nature and can easily be verified by looking at the return on capital of the business over an entire business cycle. It is amazing to find that people end up investing with managements which have consistently destroyed wealth (several airlines come to mind). I understand that at a certain price, even a value destroying business can give good returns, but a majority of the investors end up buying such companies at the peak of a cycle when the profitability seems to be high (but is just a mirage)

The second factor is far more difficult to evaluate and needs careful study of the management’s actions over time. Again it is not easy to define the right behavior in several cases such as high compensation or bending regulations to gain an undue advantage in business.

Even if we leave aside some of the fuzzy stuff, it is quite easy in a lot of cases to just reject a company if several red flags pop up. In the end, my own experience has been that if you ignore this risk, it eventually catches up. A particular investment with unethical and incompetent management may not go south, but over time the law of averages work and the overall result will be poor.

The only way to mitigate this risk to avoid such companies and management. It will prevent a lot of anxiety, heartburn and sleepless nights

Customer concentration risk [All eggs in one or few baskets]
This risk arises when a company derives a large percentage of its revenue from a handful of customers. Although this is an easy to understand risk, it not necessarily as easy to evaluate.

For example, is it better for IT and other service companies to focus on their top customers who provide 80% of their revenue instead of spreading themselves thin? I don’t have an answer to this question.

There is one crucial factor to consider when thinking of this risk – Customer lock-in. If a customer is locked in with a company and cannot easily switch then it makes sense to devote enough resource to maintain this competitive advantage.

However if a customer can easily switch suppliers based on price, then customer concentration will kill a business. A company fighting price based competition and earning its revenue from a limited set of customers is never going to earn profits above its cost of capital and is likely to remain locked in a low return business.

This risk turns up in surprising places. China as a country is the largest consumer of most commodities such as steel. So when this ‘customer’ slowed, the price of the product collapsed and has hurt all suppliers in the product category. It does not matter if as a steel company you don’t supply to the Chinese market. Once the no.1 customer in the steel industry (accounting for 50%+ of global demand) slowed, everyone in the industry was going to get hurt.

There is no easy way to mitigate this risk and it requires a case to case decision. One needs to be aware of the level of concentration for the company and check if the management is focused on either reducing the concentration or has such as hold on the key customers, that it will not be exposed to price based competition.

Competitive risk
The easiest way to think about this risk is to count the number of companies in an industry and tabulate their market share. If you find just one company and that company has a 100% share, then you have found a monopoly with no competitive risk.

At the other extreme if you start listing the companies and end up with a long list of firms with each company having a tiny share of the market, then you are looking at an industry with high competition and poor returns.

I have generally used a simple thumb rule to evaluate this risk. If the top 3-5 companies account for 60%+ of an industry and most of them earn over 15% return on capital, then the competitive intensity within the industry is low. On the other hand, if I have to spend over a week finding all the companies in an industry and if the top 10 companies account for less than 50% share (assuming I can even get this number), then it is very likely I have stumbled into an industry with high levels of competition and poor profitability.

For example – most consumer brands have limited numbers of companies and high profitability. On the other hand, industries such as cement, textiles etc are the other end of the spectrum with a large number of companies and poor profitability.

As an investor, you can manage this risk by first diversifying across industries so that a sudden worsening of the economics in a particular industry will not sink the entire portfolio. The second way to manage this risk is to study each company and its competitive position in detail so that you are atleast aware of the risks and do not get blindsided by it. Finally, as an investor one is paid to understand and manage this risk.

Change or obsolescence risk
This risk is especially relevant in fast moving industries where the underlying technologies are going through a lot of change.  Think of telecommunications – this is a fast paced industry which needs a lot of investment, but at the same time the underlying technology keeps changing rapidly (see my post herea long time back on the same topic).

We have seen the technology go from 2G to 3G to 4G to who knows what ( 5G is already being tested in labs and can do 1 gbps ). There is wifi, satellite or balloon internet and all sorts of communication tech coming up. Is it easy to predict what will be the shape of this industry in 2020? Doing a DCF analysis and putting a terminal multiple on the valuation of a telecom or similar company is sheer insanity.

The way to mitigate this risk is to have a very deep understanding of the particular industry, monitor the changes closely and not overpay for the stock. However if you do not have any specialized understanding of such an industry, it is best to stay away – discretion is often the better part of valor in investing

Commodity risk
This is the case where the price of a specific commodity drives the profitability of the business. This is obvious in the case of industries such as steel, metal, oil etc.

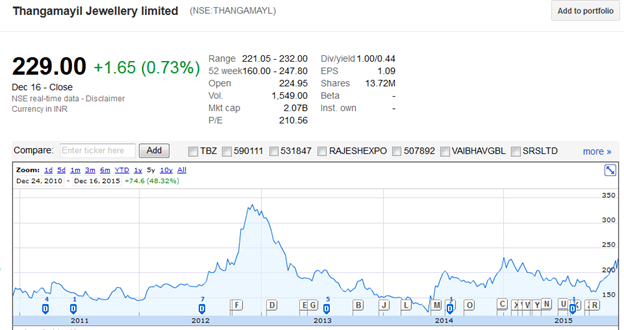
It was not so obvious in some other cases, till the commodity price dropped and hurt the industry badly. Take the example of jewelry/ gold loan companies.

These companies became the darling of the markets in the 2010-2012 period when the price of gold was going through the roof. A lot of these companies got a double boost from rising demand (due to rising gold prices) and from an increase in the value of their inventory.

Once the tide turned, some of these companies have struggled to remain profitable.

A similar story has played out in the agri space for seed companies (where the price of commodities have dropped) or mining firms.

One way to mitigate this risk is to evaluate a company over the entire business cycle and see if the company is merely the beneficiary of a lucky tailwind from rising commodity prices or will do well inspite of the commodity prices.

Capital structure risk
A company having a high debt equity ratio is generally a riskier company. What is ignored sometimes when evaluating this risk are the hidden liabilities which are the equivalent of debt, even though they do not appear as such on the balance sheet.

Take the example of tata steel and its pension liabilities or airplane lease and other fixed costs in case of airlines, which are a form of quasi debt.

The deadly combination is when some other form of business risk hits a highly indebted company. In such cases, the end result is often bankruptcy (atleast for the minority shareholders in india, promoters have no such risks)

How do you mitigate this risk? Learn to read the balance sheet carefully and understand all forms of fixed obligations which cannot be reduced even if the revenue goes down. Try to answer the question – How long will the company survive if its revenue dropped by 20%.

Valuation risk/ growth risk
This not a risk of the business risk. If you pay for the growth and it does not happen, then you are in trouble. An example which comes to mind is Hawkins cooker. A lot of investors continued to give high valuations to the company even when the growth slowed.

However once reality hit the market, the reaction was swift and sudden. As much as investors curse the management after such an event, I do not blame them for it. One can fault the management on not doing its best to deliver the highest possible growth, but then if growth is not visible, nothing stops an investor from exiting the stock for better opportunities.

There are several other companies (Which I will not name) which seem to be in a similar place – low growth, but high valuations. If we are lucky the drop in the multiple would be slow and gradual unless the growth picks up and justifies the valuations.

How do you mitigate this risk – simple, don’t follow the herd and think for yourself. If you don’t understand why a company sells for a high valuation, move on. Investing is not an exam paper where you have to answer all the questions to pass!

How to think about risks
Are you still reading? congrats !! you are true fan of this blog and also like to read boring stuff on investing J

It is easy to go on and on about risks and there are books on each type of risk. I cannot do justice to all of them in a single post. As an investor one has to evaluate all of these risk and more for each investment idea and identify which ones are the most critical.

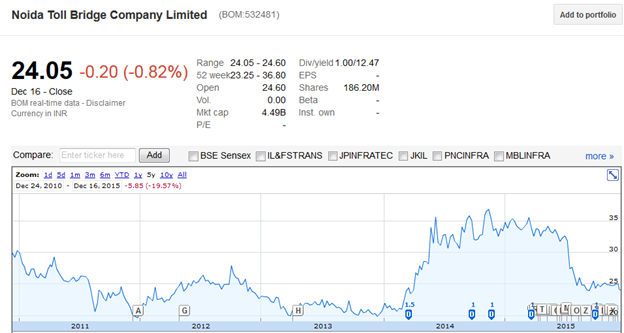
Let me give an example – I used to hold Noida toll bridge company earlier in my portfolio . As I started thinking of the risks associated with the company, there were two key ones I was able to identify

Reinvestment risk: The company had been generating a good level of free cash flow, but had no opportunity to re-invest it. A company which cannot re-invest its cash flows is equivalent to a long dated bond and will get valued as such. Hence in this case, once the company reached its steady state cash flow, the future returns were likely to follow the growth in cash flow which was expected to be in the range of 6-8%.
  Regulatory risk:  The Noida toll bridge is a BOT project with an assured 20% return during the operation period (around 30 years). On top of that if the company did not make these returns in any year, the company could just carry forward the shortfall to the subsequent years. This meant that by 2011-12 the company had close 2000 Crs+ of shortfall on its books. The ground reality was that the Noida authority had refused to raise the tolls even by the level of inflation and every time they did, there were protests and dharnas. So the chance of realizing this shortfall was low.

The key point in the above idea was that the upside was limited and there was a regulatory risk which if it materialized, could completely destroy the investment thesis. So in a stroke of brilliance, after having held the stock for 2+ years and with a minimal gain, I decided to wise up and exited the company.

In July 2015, the management announced that company was re-writing the contract which would now end by 2031 and its likely the company will not be able to recover the prior shortfall. The stock dropped promptly as the market had assumed that company would be able to make up some part of this shortfall by an extension in the lease term or land development rights.


The above case is instructive of a variety of business risks. A lot of business risks are fuzzy and grey and one cannot put a precise number behind it. In addition, these risks do not materialize for a long time. However if one does materialize, the stock market is quite efficient in resetting the valuations promptly.

As an investor, you can ignore business risks at your own peril.


No mathematical precision
You would have noticed that I have not used any greek letters or volatility measures till now to measure the business risk. It should be quite obvious that these academic measures do not represent the risks for a company.

Think of the example of Noida toll bridge – did the past volatility of the company give any indication of the regulatory risk faced by the company?

The best one can do is to be aware and analyze these risks on an ongoing basis. If you are being compensated to bear this risk (in the form of expected returns), then you continue to hold the stock. If the returns are inadequate or if you think the downside from the risk will be too severe, then the best option is to sell and move on

My current approach to evaluating the risk is usually as follows

       I have a checklist of all the above risks and use it to evaluate which of these risks are relevant for the company I am analyzing.
       I try to dig deeper into the critical risks for the company and understand what are the key drivers and how it could hurt the company and its valuation
       My job as an investor is to evaluate the upside from the bull case of the company versus the downside from all the risks facing the company. If the downside risk seems too high, I will just move on to the next idea.

One final point – if this sounds complicated and difficult to implement, let me assure you – it is and will always be. The upside is that with an increase in competition for investment returns, this may still be an area where a hardworking and diligent investor will continue to have an edge over others.
—————-
Stocks discussed in this post are for educational purpose only and not recommendations to buy or sell. Please contact a certified investment adviser for your investment decisions. Please read disclaimer towards the end of blog.

Subscription

Enter your email address if you would like to be notified when a new post is posted:

I agree to be emailed to confirm my subscription to this list

Recent Posts

Select category to filter posts

Archives