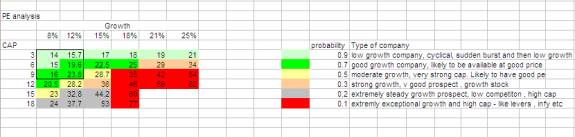
Blog

Valuation – How to evaluate the PE ratio

V

I had done a quick valuation exercise of MRO-TEK earlier (see here). I used a certain PE ratio in the post and said that I would explain my approach later. So here it goes …

To understand my approach, you have to look at the file Quantitative calculation and worksheets – cap analysis and ROC and PE. You download this file from the google groups
The worksheet ‘ROC and PE’ has DCF (discounted cash flow model) scenarios for various businesses such as Low growth, high ROC (return on capital ). For ex: Like Merck or high growth and high ROC like infosys etc.

As you can see in excel screenshot, I have put a growth of around 10% in Free cash flow, ROC of 40% and calculated the Intrinsic value (or Net present value). The ratio of the NPV/current earnings gives a rough value of PE for the above assumptions

Now I have used various assumptions of growth, ROC etc and created the matrix below (CAP analysis worksheet in the same file)

The above is for a matrix of ROC (return of capital = 15%). I have varied the growth and CAP (Competitive advantage period).

As you would expect, if growth increases, so does the intrinsic value and the PE. If the ROC increases the same happens. This is however ignored by most analysts and sometimes the market too. This is where opportunity lies sometimes. The third variable – CAP also behaves the same. Higher the period for which the company can maintain the CAP, higher the intrinsic value and higher the PE. CAP or competitive advantage period is not available from any annual report or data. It is the period for which the company can maintain an ROC above the cost of capital. For a better understanding of CAP, read this article – measuringthemoat from google groups. It’s a great article and a must read if you want to deepen your understanding of CAP and DCF based valuation approach.

As I was saying, CAP is diffcult to estimate as it depends on various factors such as the nature of industry, competitive threats etc. I usually assume a CAP of 5-8 years in my valuations. If it turns out to be more than that, then it serves as a margin of safety.

Now when I look at the company, I use the worksheet ‘ROC and PE’ and my thought process (simplified) is as follows

1. Look at ROC – does the company have an ROE or ROC of greater than 13-14% ? If yes, is it sustainable (this is subjective).
2. Use the above worksheet to select a specific ROC sceanrio.
3. What has been the growth for the company in the last 8-10 years. What is the likely growth (again subjective estimates).
4. What is the likely CAP? This is a very subjective exercise and requires studying the company and industry in detail. If the company checks out, I usually take a CAP of 5-6 years.
5. Plug the ROC, growth, CAP and current EPS numbers in the appropriate sceanrio and check the PE. That is the rough PE for the instrinsic estimate.
6. Check if the current price is 50% of the instrinsic value
7. Cross check valuation via comparitive valuations and other approaches.

If all the above checkout, it is time to pull the trigger.

In case the above has not bored you to tears, 🙂

Next posts: Some conclusions from table for CAP v/s PE v/s Growth (CAP analysis worksheet), pointers on DCF etc etc.

The black swan – unpredictability, futility of forecasting etc

T

I have just finished this book. I wrote about this book earlier here. I have also read N N Taleb’s earlier book – fooled by randomness and liked it a lot.

I will not be doing a detailed review of the book as that can be found on amazon and a lot of other website. I will however highlight some of the points, which struck me as important and how they impact me as an investor.

One of the key points, which the author makes, is about the complexity of the real world and lack of predictability. For ex: No one predicted the rise and the importance of the internet. The Internet has become one of the major forces shaping our world. It can be termed as a positive black swan. As a result all complex systems such as the economy, financial markets, which get impacted by such black swans, cannot be predicted. But that does not stop analysts and all the talking heads on TV from making predictions (predictions for 2008 etc etc)

Now one can argue that some prediction do come through. Well, you don’t have to be a guru for that. Just take some events, toss a coin and make a prediction based on the toss. You will be right 50% of the time. Analysts and TV gurus are worse than that in terms of their success rate. There are numerous studies supporting it, so you don’t have to take my word for it. Try this on your own – write down some predictions you hear this year and check back a year later.

Why are we suckers for this? because we want to resolve uncertainity and anyone who can or claims to provide visibility to the future is sought out (we do have astrologers !) . The author terms this as the narrative fallacy.

Personally, I stopped looking at predictions, analyst estimates, top picks/ hot picks etc etc long time back. If I want to be entertained I would rather watch a movie or a cricket match!

A logical question is how to invest if you do not predict. Does developing a DCF not amount to forecasting a company’s cash flow? Well it does. The difference is between a macro and a micro forecast. Forecasting a company’s cash flow is much easier than forecasting the direction of the stock market. If you know the company well, it is in your circle of competence, and you can figure out the few key variables driving the cash flow of the company then it is possible to arrive at a reasonable estimate. Will it be accurate? I don’t think so. However if you are conservative in your assumptions (don’t assume 50% growth rates) then the impact of the negative surprises would be minimal. I would not worry about positive errors (cash flow more than forecast) as I will gain from it. In addition, if you buy at a discount to the estimate of the intrinsic value (margin of safety concept), then you are protected further from errors in the forecast.

Compare this approach with macro, top down forecast. If some one says – infrastructure stocks will do well because infrastructure spending is to increase by 50%. In addition to all the stock specific factors, you thesis is also dependent on the increase in the spending which in turn depends on multiple factors. The more variables in the investment idea, the more there is a chance of something going wrong. In addition, you will also pay more for such an optimistic scenario. So if the macro forecast or something else with the company goes wrong, the losses can be severe.

HPCL – a quick review

H

I had written about HPCL earlier (see here). To recap, my main thesis was as follows.

HPCL now sells at around 9000 crores. The EV is around 10000-11000 crores at best. The replacement value of the assets is around 25000-30000 crs. The company is selling at 25-30% of replacement value, which can reduce due to the following reasons

1. The company is currently engaged in diversifying its revenue streams via various initiatives and reduce the impact of the pig headed policies of the government. These initiatives are lube marketing, Gas distribution and retail initiatives and oil trading and risk management. The market is currently not valuing any of these real options.
2. The GRM and net refining margins are at their lowest. Going forward the worst case sceanrio is that they would remain at the same level. If that is the case, the bottom line should still improve as the various company intiatives take effect (see page 53 of Annual report)
3. The 9 MMT refinery and expansion of Vizag refinery to 15 MMT and export of the petro-products and E&P activities should help the company improve its margins going forward.

So what is the situation now ? Well the company is selling at around 400 Rs/ share and the gap has now reduced to around 40% of replacement value. It is easy to declare that the original thesis has been validated. However although I think that the above reasons are still valid, they are not responsible for the reduction in the gap. I expected these reasons to play out over 1-2 years. However in the current bull run, each and every listed stock is rising almost every other day. HPCL is no different. That said, I am not complaining if I have been lucky.

These are interesting times in the market. The market is now at a PE of almost 27. Almost 1000+ stocks are now at a 52 week high and any stock which one could have picked in the last 6 months has risen. I cannot speak for others, but for me it is time to be cautious. Frankly I am having diffculty finding good ideas. It has almost become like searching for a needle in a haystack. However for me doing nothing is better than doing something stupid.

Disclosure: I have a position in the stock. As always please see the disclaimer too.

Reading the Book – The Black swan

R

I am currently reading the book – The Black swan by N N Taleb. This is a great book on low probability, high impact events which are termed as black swans.

I am still in the middle of this book. One key point which I came across is ‘confirmation bias’ on which the author has devoted a complete chapter.

The basic idea behind confirmation bias is that once we make a decision, we tend to look for evidence to confirm it. As a result we tend to ignore any negative information which could refute our decision. As a corollary to this concept, any additional information is of no use as it would only re-inforce the decision and not add any more value to the decision making process.

Like others, I am equally susceptible to this bias. My approach to reduce its impact is to write a single page thesis on an investment idea and sometimes post it on my blog. I try to gather negative information and also prefer to get negative feedback on my idea. That helps me in wieghing all negative information and arrive at a better decision (hopefully).

I am not sure if I have been entirely successfull in it, but I have rejected a few ideas after selecting them, once I was pointed out some key information (which I had missed out). In a few other cases, the negative information, which I had missed earlier resulted in reducing my estimate of intrinsic value for the stock – for ex: I missed the impact of liabilities in the case of VST. As a result I ended up taking a smaller position

And I am out !

A

For sake of disclosure, let me say that I have started exiting my position in MRO-TEK. The stock is almost at 95 and has shown an 80% rise in the last one month. It is now above my calculation of intrinsic value for the stock.

I can see the thrill of momentum investing – instant gratification. In spite of the thrill, I am not planning on changing my approach which I understand well, and have become comfortable with, over the years. In general I have seen my picks rise and approach intrinsic value in 1-2 years. That allows me to analyse the company in detail and build a decent position. Sometime I have been able to even average down on the stock as the price went lower and I developed a better understanding of the company.

A case like MRO-TEK is not really suited to my style of investing. Too soon, too fast. If the stock moves up very fast, I lose interest if it crosses my buy levels as I cannot complete the analysis and would hate to create a big position without understanding the company in depth. This approach is ofcourse contrary to most investors. However I do not have such an approach for the sake of being contrary or just because it is a smarter approach. It is just that with my time constraints and risk aversion, I prefer to analyse a company in detail before I invest in it.

Will the stock go higher …? I have no clue and am not planning to play the stock on that.

As always, please read my disclaimer

From Value to momentum – MRO TEK

F

I generally select and buy stocks where the general enthusiam for them is very low. None of my picks shoot up after I have bought them and so when a few did in the last few months, it was a new experience for me.

One such pick was MRO-TEK. I started looking at the Company a few weeks back when the stock was at around 52 per share. My analysis was as follows

About
The company is primarily into end-to-end solutions and hardware/products-provider in data communications, data access and networking fields, offering a wide range of sophisticated LAN/WAN products.
The company has a JV with RAD corporation and a few other technical collaborations. The company had a split of 30-70 of manufacturing v/s trading a few years back. In the recent years, the split has reversed to around 70-30 in terms of revenue

Performance
The company has had very erratic performance. The projections which the company made at the time of the IPO in 2000, were never met (by a huge margin). Since then the performance has been one step forward and one step back. The ROE has fluctuated between 5 and 15 %. Topline has also fluctuated and has grown by 9% per annum and the Net profit has also grown by roughly the same amount.

The margins have held steady at 9-10% and the asset turns have improved from 1.2 to 2.6

Positives
The company has maintained its margins and improved its efficiency ratios. Wcap ratio has improved from 1.5 to 6 due to improvement in inventory and recievable turns. The company has freed up cash and as a result has no debt and almost 40 Crs of cash on the balance sheet.
The company recently completed a buyback program using the surplus cash. The promoters have also been increasing their holding % in the last few years. The company has been paying a decent dividend with a DPS/EPS of around 30-40%.

Negatives
Although the management appears rational, pro-shareholder and is trying to create value, their performance has not been up to the mark. Reading the annual report reminds me of kids in school, who study hard and have the right work ethic, but still manage to flunk one or two subjects each year.
The company operates in a very competitive field with competition from likes of CISCO and LUCENT etc. This industry involves a lot of new technology, high R&D expenditure and high rates of obsolescence. MRO has only recently started investing in R&D and till recent past was mainly a distributor of networking products.

Conclusion
My personal estimate of intrinsic value was around Rs 90/ share. At 52 / share, the company was not a screaming buy, but worth creating an initial position.
I am not too optimistic on the long term economics of the company as this is a very small company in a fast paced and competitive industry. As a result it is diffcult for the company to operate at the top end of the product range and make good margins. Due to my lack of confidence on sustained good performance I conservatively estimated the intrinsic value at around 90 /share

Post script
Once I complete the analysis, I write a single page note detailing my investment thesis. This is more to record my thoughts at the time of the decision. It is useful to keep such notes as I can check them again later and check if my assumptions were true or not.


Well in this case, it never came to that. Almost from the next day the stock suddenly caught the fancy of the market. Somehow everyone has a very different opinion and as a result the stock is up almost 50-60% since then. In my case after creating an initial position, I stop buying it. Personally I buy at 40-50% of my estimate of intrinsic value and if the stock sells above that I don’t do anything. You may think I am leaving money on the table, but I prefer to follow a discplined approach. In my case I am not comfortable with trading and momentum plays and prefer to leave it to other who are better at it.

Valuation logic – 2008 EPS around 6-7 / share
PE ( will explain logic for this in a different post ) = 9-10
Cash / share = 40 Rs/ share
Total = 94 – 110 Rs/share

It was difficult NOT to do well

I

2007 has been one of those years where it was difficult NOT to make money in the stock market. At the risk of offending, let me say even a monkey would have made money. Don’t get me wrong, if you have done well this year, it does not make you a monkey 🙂 (by that measure I am a monkey too, not that I am complaining).

The monkey term is more to randomly picking stocks than to a monkey IQ. This was one of those years where almost all types of stocks did well. If you avoided some of the sectors such as IT, everything else was in a bull market. From Aug to Oct the large caps did well and since then the Mid caps have caught fire. I have seen some of the stocks almost double in the last 1-2 months. When I wrote earlier, on midcaps in may there were a decent number of opportunities available. However the valuation gaps have started closing since then and the number of opportunities have come down (although there are still a few around).

So whats in store for the next year? As if I know !! and so does no one else. I have long stopped bothering about market forecast and which sector is going to do well etc etc. The smart thing to do is to analyse companies and if you can find one selling below intrinsic value, buy it. Not all your picks will do well at the same time (unlike 2007!), but a few would.

If I started investing this year or during the current bull run (from 2003 onwards), I would want to re-analyse my approach to ensure that it was due to my own stock picking skills and not due to the rising tide. I do that every year in the following manner

– did my portfolio do better than the market index such as Sensex
– Which stocks did better than average and which did not
– What was the reason for the stocks which overperformed (luck?)
– What the reason for the stocks which underperformed and how to avoid the the cause of the underperformance

It is important to do the above analysis to ensure that the good performance was not due to luck and can be repeated again. Luck can make you money in the short run, but in the long run you will give it back. So it is critical to be brutually honest with yourself.

Ashok leyland – Private market value

A

I had written on Ashok leyland earlier.

My valuation was as follows
The company sells at a PE of 12. The current EPS is around 3.3 per share. The company can be expected to grow at 10-12% over the next few years. In addition the company has some competitive advantage such as a known brand name (especially in the south), long operating history and experience in the market, rational management and a decent distrubution/ service network.The company can be valued at around 16-18 times PE and given an intrinsic value of around 60 Rs/ share.

I recently got this email from Vishnu

I have been going through Eicher JV deal with VOLVO. It would be great if you can share your opinions.

Story:
Eicher is stepping down its Commercial Vehicle and Component business into a JV with VOLVO which is paying 275 million USD in CASH and 75 million USD in terms of VOLVO’s truck distribution business in the JV.

Valuations:
Cash(VOLVO) is paying 1045
VOLVO India Truck distribution 142
TOTAL VOLVO Share (45.6%) 1187
EICHER Share in JV (54.4%) 1416.070175
Eicher Market cap 1314
* All figures are in Crores (INR)

I have already shared my opinion on the above opportunity with him. What struck me was that the deal involved the Commercial vehicle business and the deal was valued at approximately 2000 crs. Eicher motor’s CV business had a PAT of roughly 62 crs (pretax – 82 Crs) and hence the private market value (the amount that a private investor would be willing to pay for the company, in its entirety, were it not public) seems to be around 25-30 times earnings

So Ashok leyland can be valued at 70-90 Rs/share by the above metric. My own conservative estimate was around 60/share.

Whats the point of this analysis ? well private market valuation is another approach to valuation. It may be more than your own estimate as it may include controlling premium. However if you can find the private market value to a business you are looking at, it helps in calculating the intrinsic value.

In case you are wondering if I really benifited from my research, I did not completely. I have this tendency to do detailed analysis and build my position over a period of a few months especially if the price drops reaches or drops below 50% of my estimate of intrinsic value. Ashok leyland is around 54 now, so basically the price went up before I could go beyond my initial position. That unfortunately has happened several times this year.

Why should a quick price increase be unfortunate? Well that’s another post for this wacky idea.

Maintenance capex calculation

M

I discussed about maintenance capex and its relation with Free cash flow. To recap

Free cash flow = Net earnings + depreciation – maintenance capex

And free cash flow is the money the owner of business can take out or re-invest in the business.

Maintenance capex however does not have a precise formulae. That does not mean you cannot calculate it. But as you can see, if valuation is based on free cash flow which itself is based on an imprecise measure such as maintenance capex, it cannot be precise in itself.

Valuation depends on free cash flow, project growth rates , terminal value and the discount rates. All these are estimates and hence valuation is itself an estimate. That is the reason I find it assuming when analysts give reports where they give precise valuation targets and on top of that even the duration (next one year !!) when the target would be met.

So, coming back to maintenance capex, how do I estimate it? let me warn you at the outset. My approach is self developed, imprecise and only roughly right.

I will use my valuation template to explain my approach

Worksheet – anal – In this worksheet I fill up the sales, depreciation, wcap etc. On line 26, I calculate the additional capex (additional fixed asset and Wcap for the year). Line 27 is capex as % of sales. This gives me a capex trend (total) for a period of time for the business. I then use this trend to estimate the maintenance capex.

For ex: if the business has an asset turn (on average) of 2, then I would assume capex as 2.5% of sales

Sales = 100
Asset = 50
Inflation increase in sales = 5
Corresponding asset required = 2.5 (2.5% of sales)

If the business is asset heavy (commodity industry) then the maintenance capex as % of sales is high.

If the asset turn is 1, then maintenance capex would be roughly 5% of sales. You can compare this % with depreciation as a % of sales to see if both are roughly equal.

You may find some errors in my worksheet and I plan to load an updated version soon. I don’t use these worksheet very frequently now. After using these worksheets for several years, I am now in a position where I can look at the numbers and estimate if the company looks roughly undervalued. A lot of companies don’t pass that test and are rejected outright. If a company passes that filter, I fill up the excel and go through the entire exercise (which is not very precise in itself)

I have loaded a few samples in the google groups. If you go through this exercise yourself several times, you will see patterns and it will be faster for you too.

In addition to the above excel, please have a look at the excel – Quantitative calculation – worksheet : Maintenance capex to see the relationship between Sales, Asset turns, Maintenance capex and ROC.

Ofcourse you can have a counter argument – who the hell wants to go through such an elaborate exercise to value a company? Don’t I have better things to do in life 🙂

maintenance capex and FCF

m

I received the following question from sanjay shetty via email. I will try to answer the question and have also simplified it via several assumptions

You mentioned you “use maintenance capex needed to support unit volumes or competitive position (maintenance capex).”
I downloaded your Excel sheets couldn’t figure out the basis for calculation of the same, especially as companies don’t give break ups of maintenance capex. If you could explain would be great.
Maybe my understanding is incorrect, however I feel that all Purchase of Fixed assets should be deducted from Free Cash Flow especially when the amount out there is a yearly spend by the company to grow it’s business.

Let me start with the following definition for free cash flow (paraphrased) as given by warren buffet

Free cash flow = Net earnings + depreciation – maintenance capex

Now you can take the above formulae as a given or debate whether it is correct. I think it is correct as free cash flow is basically discretionary cash which the owners (actually managers on their behalf) of the business can choose whichever way to invest. It is discretionary cash because the business is left with this cash after it has incurred the required capex to maintain its current position in terms of volume and competitive position. If it does not do that, then the business will start degrading and may eventually be wiped out.

Now the discretionary cash can be spent in the following ways

1. Invest in the buiness itself if the returns are good – most common approach. Value adding if the business earns more than cost of capital . for ex: ITC, asian paints, HLL etc. This investment is in fixed assets and working capital
2. Accquire other company – Eg. Marico
3. Return cash to shareholder via dividends or share buyback
4. Just hold cash and do nothing – Ex: Merck, Novartis etc

Now the question – How to calculate maintenance capex? There is no precise formulae for that. The best you can do is to arrive at a rough number as companies don’t give this number. Let take the definition above and let me give my approach

If the maintenance capex is to maintain unit volumes, then value sales would be growing at the rate of inflation. So lets take a hypothetical case (simplified)

Sales = 100
Return on equity = 20% ( debt = 0)
Net margin = 10%
Total asset / sales = 2
Total asset = 50
Depreciation = 5 % of asset

Now in year 2
Sales = 105 (5 % inflation)
ROE = 20%
Net margin = 10%
Total asset / sales = 2
Total asset = 52.5
FCF = 10.5+2.5-2.5 [ asset increase = 2.5 ]

So in the simple case above FCF is equal to Net profit. Ofcourse reality is not so simple. However once you get an idea of the basic concept, you can do a rough estimation of the maintenance capex and free cash flow.

Key point to remember – If the ROE is in excess of 15%, generally the depreciation will covers the maintenance capex and the Net profit will be almost equal to free cash flow.

Exception to the above can be seen in some companies such as Gujarat gas/ HLL etc where the Working capital throws off cash and hence the FCF is actually greater than the free cash flow.

So in response to the question above, I would say that some amount of the Fixed asset has to be adjusted , but I would not deduct all the addition. For ex: A company launches a very profitable product and due to volume growth puts up a new plant. The cash flow may be negative during that year and then become positive a few years later. If you focus on the cash flow based on actual capex, you may undervalue the company when it is investing in a profitable venture and over value a company which is not investing and just milking its assets.

The above post may appear fairly academic and boring, but I think the question asked by sanjay goes to the core of how to value a company.
Next post : I will try to explain how I calculate FCF using the excels I have uploaded

Subscription

Enter your email address if you would like to be notified when a new post is posted:

I agree to be emailed to confirm my subscription to this list

Recent Posts

Select category to filter posts

Archives